Free Access
Fig. 20
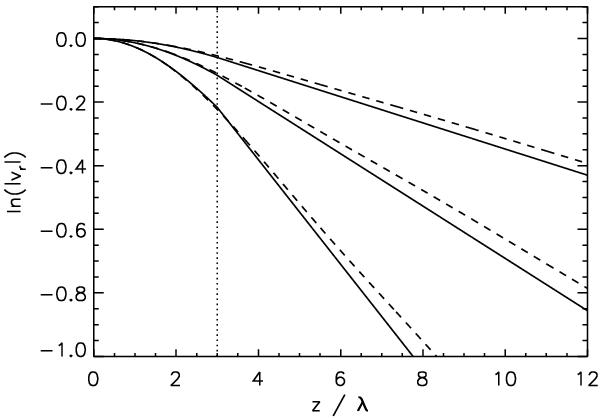
Comparison of the general spatial damping profile (Eq. (6)) (solid lines) with the full analytical solution of Hood et al. (2013) (dashed lines). The upper pair of curves is for ϵ = 0.05. The middle and lower curves are for ϵ = 0.1 and ϵ = 0.2, respectively. For all curves ρ0/ρe = 2 i.e. h = 3λ (dotted line).
Current usage metrics show cumulative count of Article Views (full-text article views including HTML views, PDF and ePub downloads, according to the available data) and Abstracts Views on Vision4Press platform.
Data correspond to usage on the plateform after 2015. The current usage metrics is available 48-96 hours after online publication and is updated daily on week days.
Initial download of the metrics may take a while.