| Issue |
A&A
Volume 551, March 2013
|
|
|---|---|---|
| Article Number | A132 | |
| Number of page(s) | 6 | |
| Section | Interstellar and circumstellar matter | |
| DOI | https://doi.org/10.1051/0004-6361/201220525 | |
| Published online | 06 March 2013 | |
Nonthermal emission properties of the northwestern rim of supernova remnant RX J0852.0-4622
1 Universiy of Bonn, Physikalisches Institut, Nussallee 12, Bonn 53115, Germany
e-mail: This email address is being protected from spambots. You need JavaScript enabled to view it.
2 Department of Physics, The University of Tokyo, Bunkyo, Tokyo 113-0033, Japan
3 Kavli Institute for Particle Astrophysics and Cosmology, SLAC National Accelerator Laboratory 2575 Sand Hill Road M/S 29, Menlo Park, CA 94025, USA
Received: 9 October 2012
Accepted: 22 January 2013
Abstract
The supernova remnant (SNR) RX J0852.0-4622 (Vela Jr., G266.6-1.2) is one of the most important SNRs for investigating the acceleration of multi-TeV particles and the origin of Galactic cosmic rays because of its strong synchrotron X-ray and TeV γ-ray emission, which show a shell-like morphology similar to each other. Using the XMM-Newton archival data consisting of multiple pointing observations of the northwestern rim of the remnant, we investigate the spatial properties of the nonthermal X-ray emission as a function of distance from an outer shock wave. All X-ray spectra are well reproduced by an absorbed power-law model above 2 keV. It is found that the spectra show gradual softening from a photon index Γ = 2.56 in the rim region to Γ = 2.96 in the interior region. We show that this radial profile can be interpreted as a gradual decrease of the cutoff energy of the electron spectrum due to synchrotron cooling. By using a simple spectral evolution model that includes continuous synchrotron losses, the spectral softening can be reproduced with the magnetic field strength in the post-shock flow to less than several tens of μG. If this is a typical magnetic field in the SNR shell, γ-ray emission would be accounted for by inverse Compton scattering of high-energy electrons that also produce the synchrotron X-ray emission. Future hard X-ray imaging observations with Nustar and ASTRO-H and TeV γ-ray observations with the Cherenkov Telescope Array (CTA) will allow us to explore other possible explanations of the systematic softening of the X-ray spectra.
Key words: radiation mechanisms: non-thermal / ISM: supernova remnants / X-rays: ISM
Panofsky Fellow.
© ESO, 2013
1. Introduction
Supernova remnants (SNRs) have been considered as major cosmic-ray (CR) accelerators below the knee energy of ~1015 eV. The measured energy density of CRs can be explained if ~10% of each supernova kinetic energy is transferred to the accelerated particles. A plausible mechanism for this particle acceleration is diffusive shock acceleration (DSA; e.g., Bell 1978; Drury 1983; Blandford & Eichler 1987). In the DSA theory, particles are accelerated at the shock, resulting in a power-law distribution, which can account for the Galactic CR spectrum using a reasonable diffusion coefficient in the Galaxy. However, many unsolved problems are still remaining, such as the acceleration efficiency, the maximum energy of the accelerated particles, and so on. Observations of synchrotron X-ray emission have been playing important roles in stimulating the development of the DSA theory. For example, magnetic field amplification at the shocks of young SNRs has been inferred from X-ray observations (e.g., Uchiyama et al. 2007) and it is now considered as an integral part of the DSA theory (e.g., Ellison & Vladimirov 2008).
RX J0852.0-4622 (also called G226.2-1.2 or Vela Jr.) is a young SNR with ~2° of an angular size in the line of sight to the Vela SNR. RX J0852.0-4622 was originally discovered in the data of the ROSAT All-Sky Survey (Aschenbach 1998). Based on the ROSAT data, whose bandpass was limited to soft X-rays below 2 keV, Aschenbach (1998) argued that the emission from the SNR can be explained either by a hot thermal model with a temperature of ~2.5 keV or by a power-law model with a photon index of Γ ~ 2.6. ASCA observations, with an imaging capability of up to ~10 keV, showed that the X-ray emission from the bright rims of RX J0852.0-4622 is dominated by a nonthermal emission characterized by a power-law with a photon index Γ ~ 2.6 (Tsunemi et al. 2000; Slane et al. 2001). The nonthermal X-ray emission is presumably of synchrotron origin. The Chandra image of the northwestern (NW) rim revealed sharp filamentary structures similar to those discovered in SN1006 (Bamba et al. 2005).
The CANGAROO collaboration claimed the detection of TeV γ-rays from the direction that coincides with the peak of the X-ray emission in the NW rim (Katagiri et al. 2005). Then, the H.E.S.S. telescopes, with their highly sensitive stereoscopic observations, have detected spatially extended TeV γ-ray emission, which shows a good spatial correlation with the nonthermal X-ray shells (Aharonian et al. 2007). The H.E.S.S. spectrum of RX J0852.0-4622 can be well fitted with a power-law of Γ ~ 2.1. Recently, the Large Area Telescope (LAT) on board the Fermi Gamma- ray Space Telescope has detected γ-ray emission from RX J0852.0-4622 in an energy band of 1–300 GeV (Tanaka et al. 2011). The LAT spectrum is described by a power-law with a photon index Γ ≃ 1.85 ± 0.06, which is substantially harder than the H.E.S.S. spectrum. The origin of the γ-ray emission has been actively debated; the GeV–TeV γ-rays can be explained either by inverse Compton (IC) scattering of high-energy electrons, or by π0-decay γ-rays produced in interactions of accelerated protons (and nuclei) with interstellar gas (Aharonian et al. 2007). SNR RX J0852.0-4622 is one of the most interesting objects for studying CR acceleration at SNR shocks.
Summary of the archive data.
 |
Fig. 1 EPIC-MOS image of the northwestern rim of RX J0852.0-4622 in an energy range of 0.5–10 keV (left) and the scheme to search for the radial profile of the synchrotron X-ray emission (right). The angular size of the summed image is larger than XMM-Newton’s FOV. Numbers in figure indicate region IDs. A contamination source in region 8 was removed from the spectral analysis. |
The age and distance of RX J0852.0-4622 are still debated. Iyudin et al. (1998) estimated an age of ~680 yr and the distance of ~200 pc based on the flux of 44Ti lines detected with COMPTEL onboard the Compton Gamma-Ray Observatory. Tsunemi et al. (2000) estimated a similar age of between 630 and 970 yr based on observations of Ca X-ray lines with ASCA. These estimates imply that RX J0852.0-4622 belongs to the supernovae that are closest to Earth. However, Slane et al. (2001) argued that the column density for the X-ray spectrum of the SNR is higher than that for the Vela SNR and that the distance to RX J0852.0-4622 should be much larger, 1–2 kpc. On the other hand, Moriguchi et al. (2001) observed the molecular distribution using 12CO (J = 1–0) emission measured with the millimeter and submillimeter telescope NANTEN. They estimated the upper limit on the distance to be ~1 kpc. Recently, a new estimate of the age and distance has been reported from an expansion measurement of the NW rim of the SNR (Katsuda et al. 2008); 1700–4300 yr and 0.75 kpc for the age and distance. Assuming a high shock speed of 3000 km s-1, these values seems probable for the SNR.
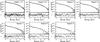 |
Fig. 2 Spectrum of each rectangular region with the best-fit absorbed power-law model. Parameters are given in the left column of Table 2. |
2. Data and analysis
2.1. Data reduction
We used XMM-Newton archival data of 14 pointing observations with slightly different aiming points. We analyzed data from the European Photon Imaging Camera (EPIC), which consists of two MOS and one PN CCD arrays. All observations were performed in the PrimeFullWindow mode, either with the medium or the thin filter. The difference between the medium and the thin filter is excluded from the following analysis since we only used a high-energy band of 2–10 keV for spectral fitting. Reduction and analysis of the data were performed following the standard procedures using the SAS 11.0.0 software package. Since the fluxes measured by the EPIC PN instrument show systematically lower values (by 10–15%) in comparison with the fluxes measured by the EPIC MOS, we used only the MOS data. The total exposure time amounts to 436 ks for EPIC-MOS1. The summary of the archive data is shown in Table 1.
2.2. Spectral analysis
To investigate the spatial properties of the nonthermal emission in the NW rim, we first combined different pointing images from EPIC-MOS1 and MOS2 with the emosaic tool. Although an expansion of the shock front over a time span of 6.5 yr was reported by Katsuda et al. (2008), we did not consider this because the possible displacement (~0.1′) due to the remnant expansion is quite small. Figure 1 shows the combined image in an energy range of 0.5–10 keV without exposure correction. Sharp edges that represent outer shock fronts can be clearly seen in the image. There is also a fainter shock structure located inside the outer boundary (see region ID 6 in Fig. 1). The X-ray emission arises from the interior past of the remnant, even ~10′ from the rim.
The source photons were accumulated from separate rectangular regions with an angular width of in the region 1–4 and in the region 5–9 as shown in Fig. 1 (right). We co-added source photons of both detectors (MOS1 and 2) to increase the statistics. Since thermal emission from the Vela SNR is dominant below 2 keV, we only used 2–10 keV for spectral fitting (Hiraga et al. 2005). All spectra were well reproduced by an absorbed power-law model. Figure 2 shows the background-subtracted spectrum of each rectangular region. The absorption column density was fixed at NH = 0.58 × 1022 cm-2, which was determined from region 1. Figure 3 (top and middle panels) shows the fitting results of the photon index and the flux integrated from 2 keV to 10 keV. The photon index shows gradual softening from 2.56 on the rim to 2.96 in the interior region. Though radial profiles of the surface brightness have been studied in various shell-type SNRs, a gradual softening of the photon index like this has not been seen before. It provides a new clue as to how high energy electrons evolve in a shock downstream. The results are summarized in Table 2 (left column).
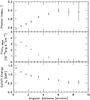 |
Fig. 3 Variation of the photon index (top panel), the flux integrated from 2 keV to 10 keV (middle panel), and the cutoff energy ϵ0 obtained from an exponential cutoff power-law model with Γ = 1.6 (bottom panel). |
Summary of the spectral fittng.
The nonthermal X-ray spectrum in RX J0852.0-4622 can be interpreted as synchrotron emission produced by high-energy electrons at a cutoff region of their energy spectrum. The observed systematic change of the photon index in the radial direction (Table 2, left column and Fig. 3, top panel) is most likely caused by the change of the cutoff position in the synchrotron spectrum. Therefore, to investigate this idea, we fit the same data by another model. We employed the following function to fit the X-ray spectrum1: ![Mathematical equation: \begin{equation} F(\epsilon)\propto\epsilon^{-\Gamma} \exp{\left[-\left( \frac{\epsilon}{\epsilon_0} \right)^{1/2}\right]}, \end{equation}](/articles/aa/full_html/2013/03/aa20525-12/aa20525-12-eq36.png) (1)where Γ is the photon index and ϵ0 is the cutoff energy. In this approach, our aim is to determine ϵ0 from the observed variation of Γ. Therefore the cutoff energy ϵ0 was treated as a free parameter, while the index Γ was fixed. This functional form can be regarded roughly as the synchrotron radiation produced by electrons with an energy distribution of
(1)where Γ is the photon index and ϵ0 is the cutoff energy. In this approach, our aim is to determine ϵ0 from the observed variation of Γ. Therefore the cutoff energy ϵ0 was treated as a free parameter, while the index Γ was fixed. This functional form can be regarded roughly as the synchrotron radiation produced by electrons with an energy distribution of ![Mathematical equation: \begin{equation} N(E)\propto E^{-p} \exp{\left[-\left(\frac{E}{E_{\rm max}}\right)\right]}, \end{equation}](/articles/aa/full_html/2013/03/aa20525-12/aa20525-12-eq37.png) (2)where Emax is the maximum energy of electrons. Applying a δ-functional approximation to the synchrotron spectrum of a single-energy electron, we obtain Eq. (1) from Eq. (2) with a relation of Γ = (p + 1)/2. Moreover, the cutoff energy of the synchrotron spectrum ϵ0 is related to Emax as (Aharonian 2000; Uchiyama et al. 2003)
(2)where Emax is the maximum energy of electrons. Applying a δ-functional approximation to the synchrotron spectrum of a single-energy electron, we obtain Eq. (1) from Eq. (2) with a relation of Γ = (p + 1)/2. Moreover, the cutoff energy of the synchrotron spectrum ϵ0 is related to Emax as (Aharonian 2000; Uchiyama et al. 2003) 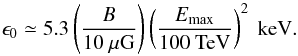 (3)In some young SNRs, a shock-acceleration spectrum with p ≃ 2.2 has been inferred from recent multiwavelength data. Hence, one should expect Γ ≃ 1.6, provided that the power-law part of the electron spectrum does not suffer from deformation due to energy-dependent losses. On the other hand, if the cooling time of the electrons responsible for the synchrotron X-ray emission is shorter than the source age, the volume-integrated spectrum is expected to be characterized by a steeper power-law part of Γ ~ 2. We adopted two cases of Γ = 1.6 and 2.0. The best-fit cutoff energies are presented in Table 2 (middle and right columns) and Fig. 3 (bottom panel). Quoted errors are at the 1σ confidence level. We obtained good fits (
 , μ) for each region.
3. Discussion
3.1. Interpretation of variation in spectral shape
The fitting results do not show any significant difference except for the absorption column density between simple power-law and exponential cutoff models because of a limited energy band. However, it is still hard to interpret that the electrons are formed in different power-law shapes with region-dependent acceleration efficiencies behind the shock front. This assumption comes from the widely accepted particle-acceleration theory, i.e., the diffusive shock acceleration or the first-order Fermi acceleration, which specifies the effective acceleration site at the shock front with a power-law electron spectrum with an index of ~2. Therefore the different photon indices can be more naturally interpreted as the presence of spectral cutoffs associated with the unavoidable cutoff in the acceleration spectrum of parent electrons. A solid evidence of such cutoff energy has been reported in a young SNR RX J1713.7-3946 (on the order of 1000 yr) with the Suzaku broadband spectrum of more than two decades in the energy band, i.e., ~40 keV (Tanaka et al. 2008). Although the FoV of the Suzaku HXD is not small enough to allow detailed imaging spectroscopy, Tanaka et al. (2008)’s study suggests that a spectral cutoff is a common feature for the synchrotron spectrum, which shows a typical photon index of 2–3 below 10 keV of shell-type SNRs. We note that the obtained absorption column density also indirectly suggests the presence of the energy cutoff in the spectrum of the Vela Jr. Slane et al. (2001) pointed out that the column density for the power-law is significantly higher than that for Vela SNR, e.g., ~1020 cm-2 (Bocchino et al. 1999; Aschenbach et al. 1995). If we assume the distance to the Vela Jr. to be 0.75 kpc, the lower column density with the exponential cutoff model, i.e., 1.4 × 1021 cm-2, seems physically preferable in comparison with a distance to the Vela SNR of ~0.25 kpc (Cha et al. 1999). We thus interpret the different photon indices as energy cutoffs of the parent electron spectra in the following discussion.
3.2. Synchrotron cooling effect on the cutoff energy
The variation of the cutoff energy reflects the time evolution of the electron spectrum. Once a particle distribution has been injected at the shock, it evolves downstream, suffering from radiative losses and adiabatic expansion losses. We first ignored the adiabatic loss and focused on the synchrotron cooling effect on the cutoff energies to estimate an upper limit of the magnetic field strength. We consider the following equation to describe a time evolution of electrons in a certain volume element only subject to synchrotron losses: ![Mathematical equation: \begin{equation} \frac{\partial N(E)}{\partial t}=\frac{\partial}{\partial E}[b(E)N(E)]+Q(E,t), \end{equation}](/articles/aa/full_html/2013/03/aa20525-12/aa20525-12-eq51.png) (4)where t denotes time elapsed since the shock, b(E) = aE2 is the energy loss rate of the electrons, namely,
(4)where t denotes time elapsed since the shock, b(E) = aE2 is the energy loss rate of the electrons, namely,  , and Q(E) is a source term that describes the rate of injection of electrons and their injection spectrum into the source region. If we assume the injection of electrons with a power-law energy spectrum at t = 0 without subsequent injection of electrons, we can write the electron spectrum as Q(E) = κE− pδ(t), where δ(t) is the Dirac delta function. It is straightforward to show that the solution of Eq. (4) is given as (Longair 1994)
 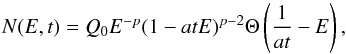 (5)where Θ is a step function. The factor (1 − atE)p − 2 represents a cutoff shape at Ecut = (at)-1 due to synchrotron losses. We may interpret Emax of Eq. (2) as Ecut. However, since the injection spectrum also has a cutoff in reality, this interpretation would not be always appropriate.
If we assume that the downstream evolution of Emax is simply determined by synchrotron losses, we can obtain the time evolution of the electron energy by integrating the energy loss function, i.e.,  , and then,
  (6)where E0 ≡ Emax(t = 0). The radial evolution of ϵ0 can be calculated from Emax(t) with a transformation of t into x, which is the distance from the shock to the volume element. We assume that the shock velocity has a time dependence of V ∝ T− 3/5 (the Sedov-Taylor evolution), where T denotes the age of the remnant. The coefficient of the synchrotron energy loss rate a is given as
 ![Mathematical equation: \begin{eqnarray} b(E)&=&aE^{2}\nonumber\\ &=&6.6\times 10^{4}\gamma^{2}B^{2}~[{\rm eV/s}] \nonumber\\ &=&2.52\times\left( \frac{B}{10~\mu{\rm G}}\right)^{2} \left(\frac{E}{100~{\rm TeV}}\right)^{2}~[{\rm keV/s}], \end{eqnarray}](/articles/aa/full_html/2013/03/aa20525-12/aa20525-12-eq72.png) (7)where γ is the Lorentz factor of the electron, and B is magnetic field strength. Defining k = a/B2, Eq. (6) can be written as
(7)where γ is the Lorentz factor of the electron, and B is magnetic field strength. Defining k = a/B2, Eq. (6) can be written as ![Mathematical equation: \begin{equation} E_{\rm max}(x)\propto\left[kB^{2} t + E_0^{-1}\right]^{-1}, \end{equation}](/articles/aa/full_html/2013/03/aa20525-12/aa20525-12-eq75.png) (8)where B is the magnetic field strength (assumed to be constant in t, i.e., B is uniform downstream, as well as T, i.e., B is uniform upstream of the forward shock). From Eq. (3) we can obtain the cutoff photon energy as
(8)where B is the magnetic field strength (assumed to be constant in t, i.e., B is uniform downstream, as well as T, i.e., B is uniform upstream of the forward shock). From Eq. (3) we can obtain the cutoff photon energy as ![Mathematical equation: \begin{equation} \epsilon_0(x)\propto B \left[kB^2 t +E_0^{-1}\right]^{-2}. \end{equation}](/articles/aa/full_html/2013/03/aa20525-12/aa20525-12-eq76.png) (9)We adopt a current shock velocity of V = 3000 km s-1 and distance of D = 0.75 kpc (Katsuda et al. 2008). The coeffcient E0 is chosen so that the spatial curves pass the initial data point. Then, the magnetic field strength controls the spatial variation of the cutoff energy. The time-dependence of the shock velocity, i.e., the Sedov-Taylor evolution, is included in the model. We used Vrel = (1/4)V as a relative speed between the shock front and post-shock gas to transform t into x. Figure 4 shows the spatial dependence of the cutoff energy with the time-dependent spectral evolution model. The magnetic field strength of B ~ 10 μG can reproduce the decrease of ϵ0 as a function of x under the assumption that the field strength does not change both in time and space. We note that a projection effect, which is neglected in our analysis, dilutes the spatial variation of ϵ0, and consequently could increase the required magnetic field strength somewhat.
(9)We adopt a current shock velocity of V = 3000 km s-1 and distance of D = 0.75 kpc (Katsuda et al. 2008). The coeffcient E0 is chosen so that the spatial curves pass the initial data point. Then, the magnetic field strength controls the spatial variation of the cutoff energy. The time-dependence of the shock velocity, i.e., the Sedov-Taylor evolution, is included in the model. We used Vrel = (1/4)V as a relative speed between the shock front and post-shock gas to transform t into x. Figure 4 shows the spatial dependence of the cutoff energy with the time-dependent spectral evolution model. The magnetic field strength of B ~ 10 μG can reproduce the decrease of ϵ0 as a function of x under the assumption that the field strength does not change both in time and space. We note that a projection effect, which is neglected in our analysis, dilutes the spatial variation of ϵ0, and consequently could increase the required magnetic field strength somewhat.
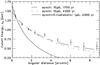 |
Fig. 4 Spatial dependence of the cutoff energy ϵ0 obtained from the exponential cutoff power-law model of Γ = 1.6 with the time-dependent spectral evolution model. |
3.3. Adiabatic and inverse Compton scattering effects on the cutoff energy
The electrons would significantly suffer from the adiabatic losses. In this case, the required magnetic field strength becomes lower than the above estimated value, and then the inverse Compton scattering effect also needs to be considered. The adiabatic loss rate for the electrons due to expansion of the volume is given as (Longair 1994)  (10)where a is the fluid coordinate along the radius of the remnant R. Here we again assume that an electron population has been confined within a region of certain volume and injected at the shock in a fluid form. The energetic electron fluid does work adiabatically as it expands, and consequently loses its internal energy.
As for the inverse Compton scattering, the seed photon fields include the cosmic microwave background (CMB) and Galactic infrared and optical fields in the interstellar medium. In general, the photon fields produced locally by the SNR itself would not contribute to the target soft photons and Compton scattering of CMB photons should dominate the others. In the Thomson regime, the energy-loss rate via inverse Compton scattering of the CMB field is written as  (11)where σT is the Thomson cross-section, β is the velocity of an energetic electron in units of the speed of light c, and UCMB ≃ 0.26 eV cm-3 is the energy density of CMB photons. We initially assumed an input electron spectrum as an exponential power-law shape with p = 2.2 and numerically calculated the electron spectrum after losing energy due to the synchrotron, adiabatic, and inverse Compton scattering effects. The cutoff energies were obtained by fitting the synchrotron spectra produced by the continuously energy-modulated electron spectra. We assumed a uniform interstellar magnetic field strength of ~1 μG. As is shown in Fig. 4, the adiabatic effect dominates over the synchrotron cooling and the cutoff variation can be explained without radiation losses. In the adiabatic loss-dominant case, a site of the magnetic field amplification might be focused on the bright filament region and the field strength of the inner regions is similar to a normal interstellar magnetic field. The magnetic field strength of the filament is estimated as ~6 μG from the X-ray/TeV observations and the leptonic model (Aharonian et al. 2007). This implies that the magnetic field amplification near the shock occurs only moderately in the SNR. However, Eq. (10) might be a too simplified assumption because the electron population might not be suitable as an ideal expanding fluid for over 1 kyr, e.g., at a post shock flow speed on the order of 3000/4 km s-1, electrons fall behind the shock 1′ or 6.74 × 10¹² km in ~300 yr. Thus we conclude that the magnetic field strength near the filament is estimated to be between 6–10 μG.
3.4. Application of MHD-based model to the radial profile
To confirm the consistency of the above estimated magnetic field strength with an MHD- based calculation, we applied the analytical model proposed by Petruk et al. (2011) to the obtained radial profile. This model accounts for the projection and other MHD effects, such as a variation of the magnetic field strength in the post-shock region, and calculates synchrotron images of SNRs of the Sedov-Taylor phase in a uniform interstellar medium. Figure 5 shows the comparison between the observed radial profile of the X-ray flux and the model curves. We assumed the cutoff energy near the shock front to be ϵ0 = 4 keV and the shock obliquity angle Θ0 = 0°, which is defined as the angle between the magnetic field and the normal to the shock. For other parameters, we used typical values as follows: κad = 1, κr = 8.25, σ = 4, γ = 5/3, b = 0, q = 0, t = 1000 yr, ϵkeV = 2 keV (see Petruk et al. 2009, 2011, for the definitions of the model parameters).
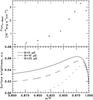 |
Fig. 5 Radial profiles of the observed X-ray flux (top panel) and approximation models (bottom panel), proposed by Petruk et al. (2011). The horizontal axis indicates the normalized distance from the outer shock wave. |
We calculated radial profiles for three sets of (B, Emax): (i) B = 5 μG and Emax = 122.8 TeV; (ii) B = 10 μG and Emax = 87 TeV; and (iii) B = 20 μG and Emax = 61.4 TeV. Each set gives ϵ0 = 4 keV using Eq. (3). The angular radius of the SNR was adopted to be R = 1°. The radial profile of the
X-ray flux is broadly consistent with the models with B = 5 − 20 μG, which roughly agrees with the magnetic field used above to reproduce the spatial variation of ϵ0.
If the γ-ray emission detected by Fermi and H.E.S.S. is predominantly caused by IC scattering, the magnetic field in the γ-ray production region should be ~10 μG because of the measured ratio of the TeV γ-ray and X-ray energy fluxes, ωγ (1−10 TeV)/ωX (2–10 KeV)~ 2 (Aharonian et al. 2005). The magnetic field required to explain the radial profile would favor the leptonic model. However, this is not conclusive because the observational constraints are not sufficient to explore other possibilities that may account for the variation of ϵ0. More detailed multiwavelength observations are necessary to place more definitive constraints on the magnetic field and to elucidate the γ-ray emission mechanism.
The high-energy cutoff of shock-accelerated electrons is due to the balance between acceleration and synchrotron radiation losses at the shock front if the magnetic field is strong. Zirakashvili & Aharonian (2007) have derived the energy spectrum of synchrotron radiation under such circumstances. To allow for other scenarios for the formation of the spectral cutoff, we employed Eq. (1).
References
- Aharonian, F. A. 2000, New A, 5, 377 [NASA ADS] [CrossRef] [Google Scholar]
- Aharonian, F., Akhperjanian, A. G., Bazer-Bachi, A. R., et al. 2005, A&A, 437, L7 [NASA ADS] [CrossRef] [EDP Sciences] [Google Scholar]
- Aharonian, F., Akhperjanian, A. G., Bazer-Bachi, A. R., et al. 2007, ApJ, 661, 236 [NASA ADS] [CrossRef] [Google Scholar]
- Aschenbach, B. 1998, Nature, 396, 141 [NASA ADS] [CrossRef] [Google Scholar]
- Aschenbach, B., Egger, R., & Trümper, J. 1995, Nature, 373, 587 [NASA ADS] [CrossRef] [Google Scholar]
- Bamba, A., Yamazaki, R., & Hiraga, J. S. 2005, ApJ, 632, 294 [NASA ADS] [CrossRef] [Google Scholar]
- Bell, A. R. 1978, MNRAS, 182, 147 [NASA ADS] [CrossRef] [Google Scholar]
- Berezhko, E. G., & Völk, H. J. 2004, A&A, 419, L27 [NASA ADS] [CrossRef] [EDP Sciences] [Google Scholar]
- Blandford, R., & Eichler, D. 1987, Phys. Rep., 154, 1 [Google Scholar]
- Bocchino, F., Maggio, A., & Sciortino, S. 1999, A&A, 342, 839 [NASA ADS] [Google Scholar]
- Cha, A. N., Sembach, K. R., & Danks, A. C. 1999, ApJ, 515, L25 [NASA ADS] [CrossRef] [Google Scholar]
- Drury, L. O. 1983, Rep. Progr. Phys., 46, 973 [Google Scholar]
- Ellison, D. C., & Vladimirov, A. 2008, ApJ, 673, L47 [NASA ADS] [CrossRef] [Google Scholar]
- Hiraga, J. S., Uchiyama, Y., Takahashi, T., & Aharonian, F. A. 2005, A&A, 431, 953 [NASA ADS] [CrossRef] [EDP Sciences] [Google Scholar]
- Iyudin, A. F., Schönfelder, V., Bennett, K., et al. 1998, Nature, 396, 142 [NASA ADS] [CrossRef] [Google Scholar]
- Katagiri, H., Enomoto, R., Ksenofontov, L. T., et al. 2005, ApJ, 619, L163 [NASA ADS] [CrossRef] [Google Scholar]
- Katsuda, S., Tsunemi, H., & Mori, K. 2008, ApJ, 678, L35 [NASA ADS] [CrossRef] [Google Scholar]
- Longair, M. S. 1994, High Energy Astrophysics (Cambridge University Press) [Google Scholar]
- Moriguchi, Y., Yamaguchi, N., Onishi, T., Mizuno, A., & Fukui, Y. 2001, PASJ, 53, 1025 [NASA ADS] [CrossRef] [Google Scholar]
- Petruk, O., Beshley, V., Bocchino, F., & Orlando, S. 2009, MNRAS, 395, 1467 [NASA ADS] [CrossRef] [Google Scholar]
- Petruk, O., Orlando, S., Beshley, V., & Bocchino, F. 2011, MNRAS, 413, 1657 [NASA ADS] [CrossRef] [Google Scholar]
- Reynolds, S. P. 1998, ApJ, 493, 375 [NASA ADS] [CrossRef] [Google Scholar]
- Slane, P., Hughes, J. P., Edgar, R. J., et al. 2001, ApJ, 548, 814 [NASA ADS] [CrossRef] [Google Scholar]
- Tanaka, T., Uchiyama, Y., Aharonian, F. A., et al. 2008, ApJ, 685, 988 [NASA ADS] [CrossRef] [Google Scholar]
- Tanaka, T., Allafort, A., Ballet, J., et al. 2011, ApJ, 740, L51 [NASA ADS] [CrossRef] [Google Scholar]
- Tsunemi, H., Miyata, E., Aschenbach, B., Hiraga, J., & Akutsu, D. 2000, PASJ, 52, 887 [NASA ADS] [Google Scholar]
- Uchiyama, Y., Aharonian, F. A., & Takahashi, T. 2003, A&A, 400, 567 [NASA ADS] [CrossRef] [EDP Sciences] [Google Scholar]
- Uchiyama, Y., Aharonian, F. A., Tanaka, T., Takahashi, T., & Maeda, Y. 2007, Nature, 449, 576 [NASA ADS] [CrossRef] [PubMed] [Google Scholar]
- Zirakashvili, V. N., & Aharonian, F. 2007, A&A, 465, 695 [NASA ADS] [CrossRef] [EDP Sciences] [Google Scholar]
All Tables
All Figures
|
Fig. 1 EPIC-MOS image of the northwestern rim of RX J0852.0-4622 in an energy range of 0.5–10 keV (left) and the scheme to search for the radial profile of the synchrotron X-ray emission (right). The angular size of the summed image is larger than XMM-Newton’s FOV. Numbers in figure indicate region IDs. A contamination source in region 8 was removed from the spectral analysis. |
| In the text | |
|
Fig. 2 Spectrum of each rectangular region with the best-fit absorbed power-law model. Parameters are given in the left column of Table 2. |
| In the text | |
|
Fig. 3 Variation of the photon index (top panel), the flux integrated from 2 keV to 10 keV (middle panel), and the cutoff energy ϵ0 obtained from an exponential cutoff power-law model with Γ = 1.6 (bottom panel). |
| In the text | |
|
Fig. 4 Spatial dependence of the cutoff energy ϵ0 obtained from the exponential cutoff power-law model of Γ = 1.6 with the time-dependent spectral evolution model. |
| In the text | |
|
Fig. 5 Radial profiles of the observed X-ray flux (top panel) and approximation models (bottom panel), proposed by Petruk et al. (2011). The horizontal axis indicates the normalized distance from the outer shock wave. |
| In the text | |
Current usage metrics show cumulative count of Article Views (full-text article views including HTML views, PDF and ePub downloads, according to the available data) and Abstracts Views on Vision4Press platform.
Data correspond to usage on the plateform after 2015. The current usage metrics is available 48-96 hours after online publication and is updated daily on week days.
Initial download of the metrics may take a while.