Free Access
Fig. 5
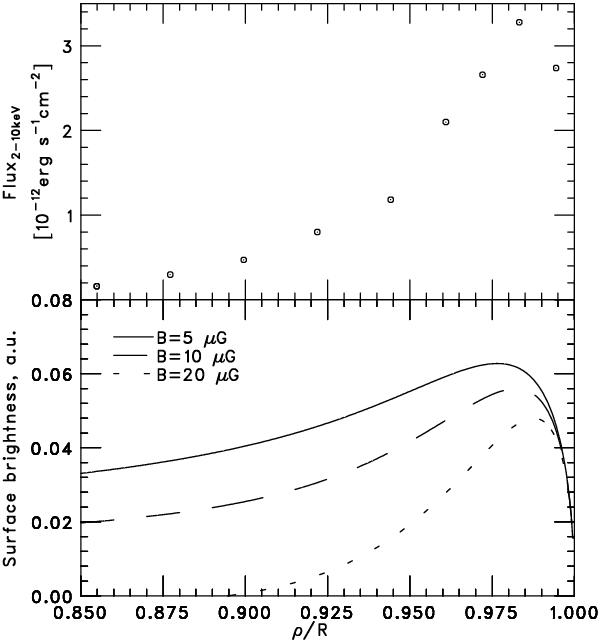
Radial profiles of the observed X-ray flux (top panel) and approximation models (bottom panel), proposed by Petruk et al. (2011). The horizontal axis indicates the normalized distance from the outer shock wave.
Current usage metrics show cumulative count of Article Views (full-text article views including HTML views, PDF and ePub downloads, according to the available data) and Abstracts Views on Vision4Press platform.
Data correspond to usage on the plateform after 2015. The current usage metrics is available 48-96 hours after online publication and is updated daily on week days.
Initial download of the metrics may take a while.