Fig. 3
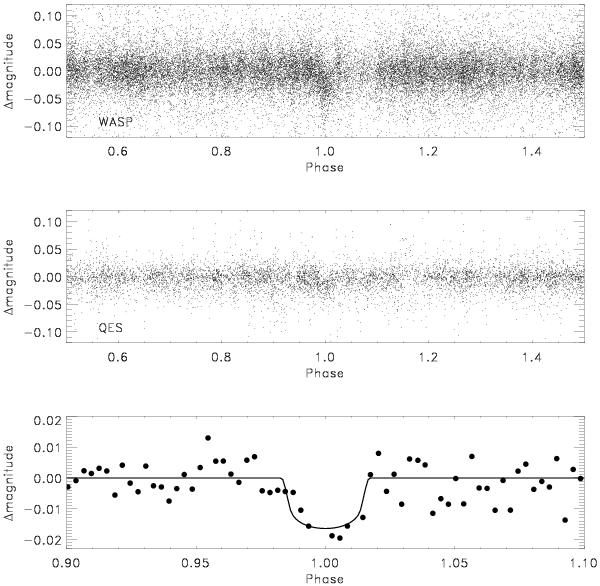
Upper panel: discovery WASP light curve of WASP-57b phase folded on the ephemeris given in Table 5. Middle panel: QES light curve of WASP-57b. Lower panel: binned WASP light curve of WASP-57b. Black-solid line, is the best-fit transit model estimated using the formalism from Mandel & Agol (2002).
Current usage metrics show cumulative count of Article Views (full-text article views including HTML views, PDF and ePub downloads, according to the available data) and Abstracts Views on Vision4Press platform.
Data correspond to usage on the plateform after 2015. The current usage metrics is available 48-96 hours after online publication and is updated daily on week days.
Initial download of the metrics may take a while.