Fig. B.11
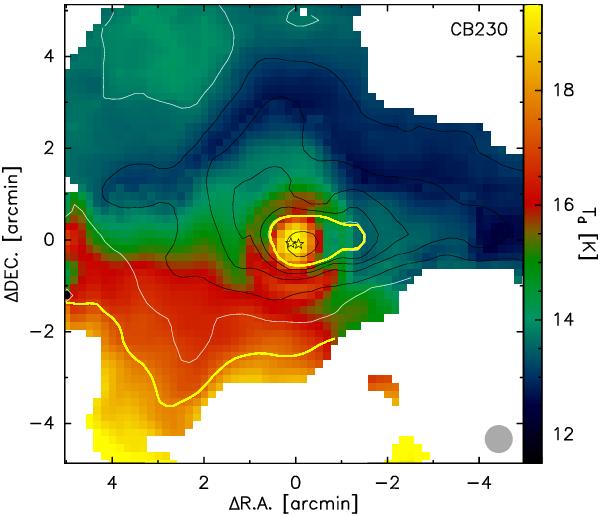
Dust temperature map of CB 230 (color scale), overlaid with contours of the hydrogen column density (white: 1021 and 1022 cm-2, black: 2, 4, 6, 8, and 20 × 1021 cm-2). Yellow contours mark Nout (Eq. (3)) and N1′ (Eq. (10)). The two asterisks mark the positions of the embedded YSOs (see Launhardt et al. 2010).
Current usage metrics show cumulative count of Article Views (full-text article views including HTML views, PDF and ePub downloads, according to the available data) and Abstracts Views on Vision4Press platform.
Data correspond to usage on the plateform after 2015. The current usage metrics is available 48-96 hours after online publication and is updated daily on week days.
Initial download of the metrics may take a while.