Fig. A.6
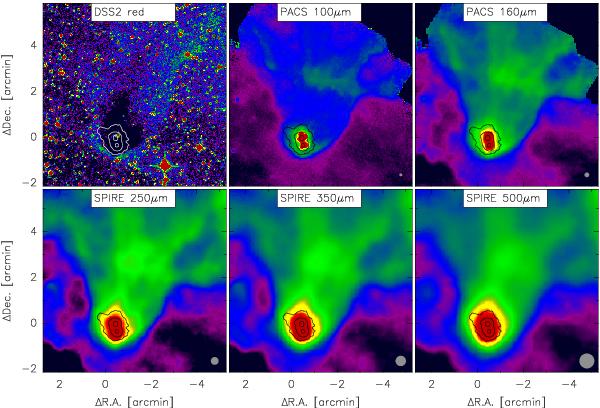
BHR 12 (Class 0/I protostars): visual (red) DSS2 image and Herschel FIR maps (color; log scale) at 100, 160, 250, 350, and 500 μm, with 850 μm continuum contours overlaid (SCUBA; 120, 300, and 900 mJy/15′′ beam). Herschel beam sizes are indicated as gray circles in the lower right corners.
Current usage metrics show cumulative count of Article Views (full-text article views including HTML views, PDF and ePub downloads, according to the available data) and Abstracts Views on Vision4Press platform.
Data correspond to usage on the plateform after 2015. The current usage metrics is available 48-96 hours after online publication and is updated daily on week days.
Initial download of the metrics may take a while.