Fig. 11
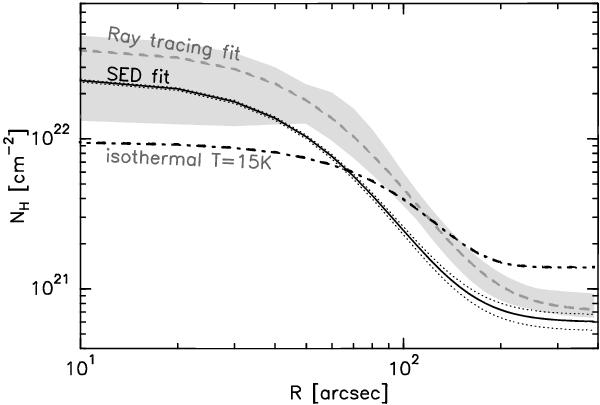
Comparison of radial column density profiles of B 68, derived with the LoS-averaged temperature recovery method described in this paper (black solid line, uncertainty range marked by dotted lines), with the assumption of isothermal dust emission (dash-dotted line), and with a ray-tracing approach that takes LoS temperature gradients into account (gray dashed line, uncertainty range marked by gray-shaded area, Nielbock et al. 2012, corrected for OH5 opacities).
Current usage metrics show cumulative count of Article Views (full-text article views including HTML views, PDF and ePub downloads, according to the available data) and Abstracts Views on Vision4Press platform.
Data correspond to usage on the plateform after 2015. The current usage metrics is available 48-96 hours after online publication and is updated daily on week days.
Initial download of the metrics may take a while.