Fig. 2
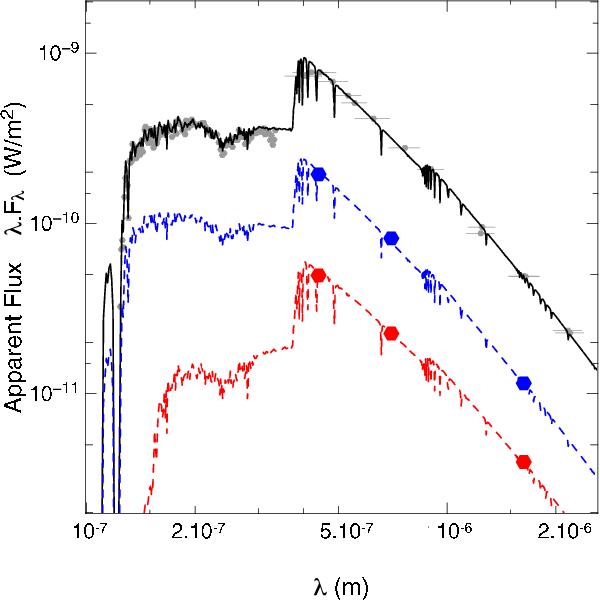
Observed SED of the integrated flux of the binary (gray points), modeled by a sum of two Kurucz models with the stellar parameters described in Sect. 3 (solid black line). The red and blue circles are the flux of the primary and the secondary obtained by combining the observed flux ratio with the total flux at nearby wavelengths. These points are lowered by half a decade for clarity purpose. The dashed lines represent the flux of the corresponding Kurucz models.
Current usage metrics show cumulative count of Article Views (full-text article views including HTML views, PDF and ePub downloads, according to the available data) and Abstracts Views on Vision4Press platform.
Data correspond to usage on the plateform after 2015. The current usage metrics is available 48-96 hours after online publication and is updated daily on week days.
Initial download of the metrics may take a while.