Fig. 5
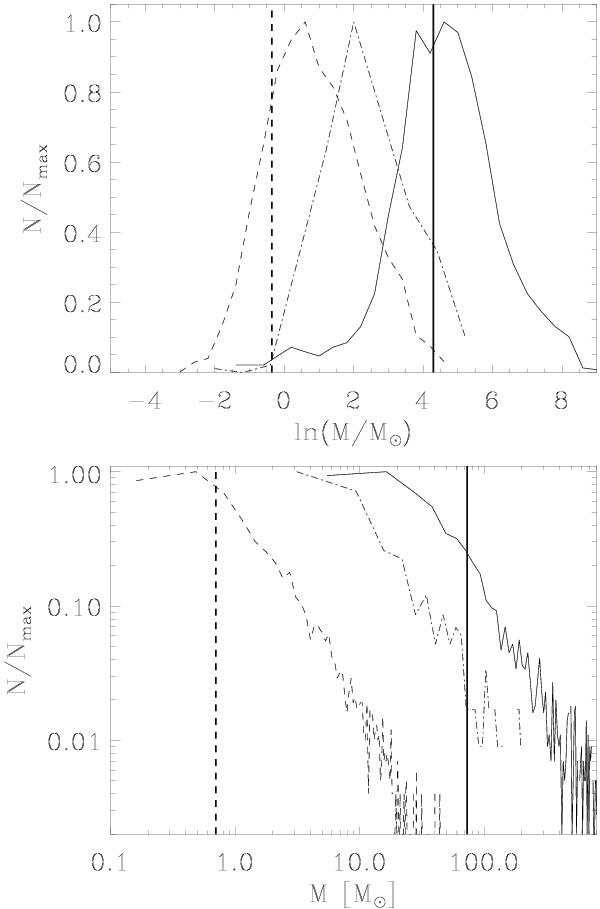
Top. Histogram profiles from Fig. 4, with solid and dashed lines representing the ℓ = 30° and ℓ = 59° fields, respectively. The dash-dotted line represents the distribution obtained for the ℓ = 59° field traslated to the distance of ℓ = 30° (see text). Bottom. CMF profiles from Fig. 3; line styles are as before. The vertical lines mark the completeness limits listed in Table 3 for the ℓ = 30° (solid line) and ℓ = 59° (dashed line) fields.
Current usage metrics show cumulative count of Article Views (full-text article views including HTML views, PDF and ePub downloads, according to the available data) and Abstracts Views on Vision4Press platform.
Data correspond to usage on the plateform after 2015. The current usage metrics is available 48-96 hours after online publication and is updated daily on week days.
Initial download of the metrics may take a while.