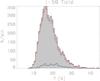
Fig. 3
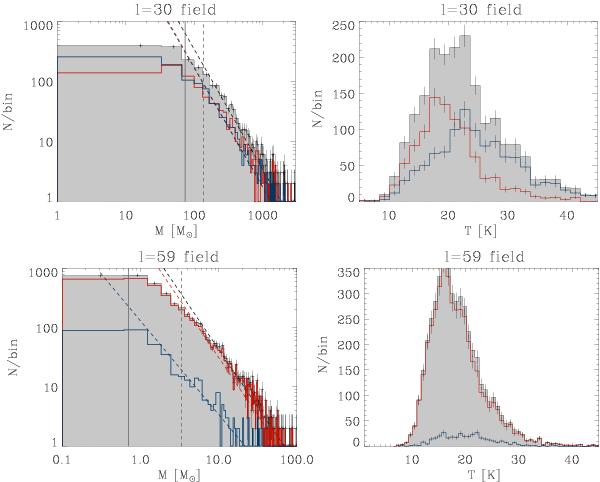
Left panels. Log–log histograms showing the distribution of M for all (black), starless (red) and proto-stellar (blue) clumps in the ℓ = 30° (top) and ℓ = 59° (bottom) fields. The bin width has been chosen according to the Freedman and Diaconis’ rule (see Sect. 6.3). The dashed lines represent the results of fit to the data using the procedure PLFIT. The vertical dashed line corresponds to the value of Minf, whereas the solid vertical line shows the 80% completeness limits (see Sect. 3.1 and Table 3). Vertical bars show Poisson errors. Right panels. Histograms showing the distribution of clump temperature (color codes are as in the left panels) in the ℓ = 30° (top) and ℓ = 59° (bottom) fields. The bin width has also been chosen according to the Freedman and Diaconis’ rule. Line styles are as before.
Current usage metrics show cumulative count of Article Views (full-text article views including HTML views, PDF and ePub downloads, according to the available data) and Abstracts Views on Vision4Press platform.
Data correspond to usage on the plateform after 2015. The current usage metrics is available 48-96 hours after online publication and is updated daily on week days.
Initial download of the metrics may take a while.