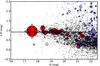
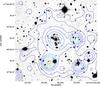
Fig. 6
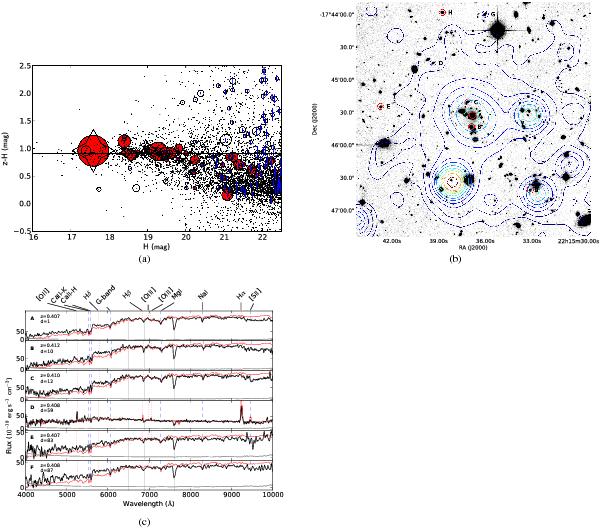
a) Colour–magnitude diagram for the extended X-ray source ext#1. CFTHLS D4 z′ and H-band images have been used. The small dots show all galaxies within D4 having cluster-concordant photometric redshifts, i.e. within the area between the dashed lines in Fig. 3. Open circles show all galaxies with good photometry <1 Mpc from the X-ray peak, of which the filled symbols have cluster-concordant photometric redshifts. Vertical dashes indicate the error in the colour. Star symbols indicate spectroscopic members. All symbols (apart from the dots) have been scaled, inversely, to their physical distance from the X-ray emission peak. In each panel, the horizontal line indicates the expected colour of luminous, red sequence galaxies at the given spectroscopic redshift, as obtained from the simple stellar population models calibrated on data available in Fassbender et al. (2011a). b) CFTHLS D4 z′-band image centred on the extended X-ray sources in the field. The blue and red circles indicate the positions of the spectroscopically confirmed star forming and passive cluster members, respectively. The contours overlay represent linearly spaced photon count levels of the X-ray sources. North is up, east is to the right. The image is 1.2 arcmin across. c) Selected spectra for cluster ext#1 in the observers’ frame in black and their noise spectra in grey. Either an elliptical or emission template is overplotted in red. The positions of expected absorption and emission features have been indicated with blue dashed and red dotted lines, respectively. Vertical grey lines indicate regions affected by sky absorption. The spectra have been smoothed for clarity. The capital letters correspond to the entries in Table 6 and to the positions in Fig. 6(b). The redshift z and the distance d (arcsec) to the formal peak of the X-ray source are indicated in the plot.
Current usage metrics show cumulative count of Article Views (full-text article views including HTML views, PDF and ePub downloads, according to the available data) and Abstracts Views on Vision4Press platform.
Data correspond to usage on the plateform after 2015. The current usage metrics is available 48-96 hours after online publication and is updated daily on week days.
Initial download of the metrics may take a while.