Free Access
Fig. 9
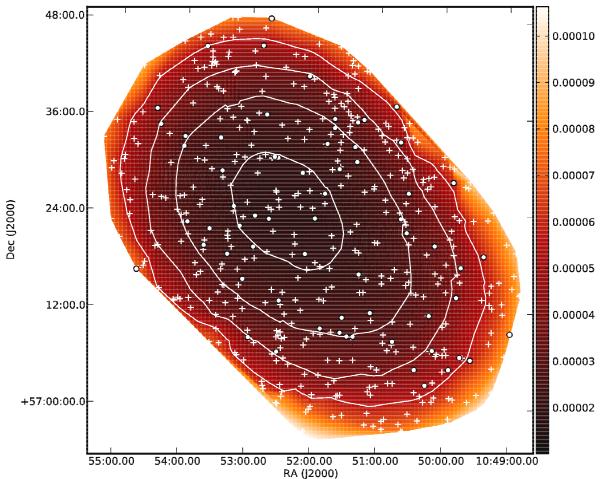
Sensitivity map of the VLBA observations. The rms noise of the individual images has
been placed on a grid and then linearly interpolated to fill the map. The colour bar
indicates Jy, and contours were drawn at  ,
n = 0...3.
,
n = 0...3.
Current usage metrics show cumulative count of Article Views (full-text article views including HTML views, PDF and ePub downloads, according to the available data) and Abstracts Views on Vision4Press platform.
Data correspond to usage on the plateform after 2015. The current usage metrics is available 48-96 hours after online publication and is updated daily on week days.
Initial download of the metrics may take a while.