Fig. 6
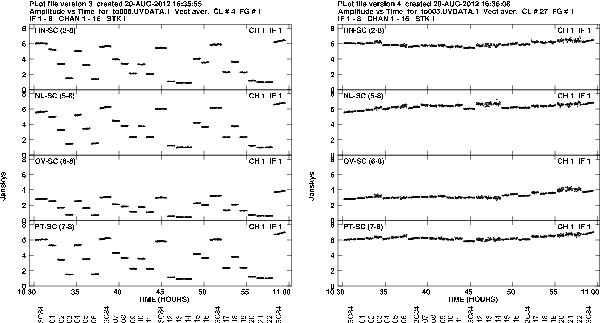
Visibility amplitudes before and after primary beam correction. Left panel: visibility amplitudes from all pointings on a few selected baselines before primary beam correction. The pointing centres are indicated at the bottom of the diagram. Shown is total intensity after averaging all frequencies and the two polarisations. Right panel: the same visibilities after primary beam correction. Whilst there are only small steps and discontinuities in the corrected visibilities (indicating that the correction scheme is working well), there are longer-term trends in the amplitudes, which may be attributed to the substantial structure of 3C 84, which was not modelled due to the poor (u,v) coverage of the data. The larger scatter during some pointings is a consequence of the reduced sensitivity towards directions well away from the pointing centre.
Current usage metrics show cumulative count of Article Views (full-text article views including HTML views, PDF and ePub downloads, according to the available data) and Abstracts Views on Vision4Press platform.
Data correspond to usage on the plateform after 2015. The current usage metrics is available 48-96 hours after online publication and is updated daily on week days.
Initial download of the metrics may take a while.