Fig. 5
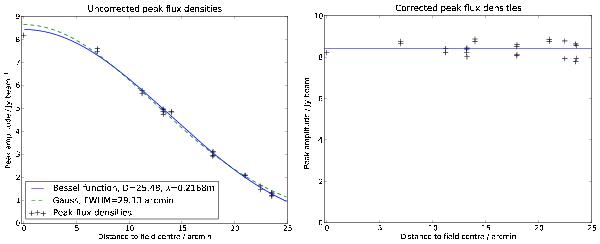
Peak flux densities of 3C 84 before and after primary beam correction. Left panel: peak amplitudes measured using the pointings in Fig. 4 as a function of distance to the true source position. Also shown are two fits to the data, one using a Gaussian (dashed line) and one using an Airy disk (solid line). The Airy disk performs slightly better. Right panel: peak amplitudes after applying the primary beam corrections using an Airy disk model fitted to the data in the left panel. The standard deviation of the measurements, normalised to their mean (shown as the solid line), is 0.039.
Current usage metrics show cumulative count of Article Views (full-text article views including HTML views, PDF and ePub downloads, according to the available data) and Abstracts Views on Vision4Press platform.
Data correspond to usage on the plateform after 2015. The current usage metrics is available 48-96 hours after online publication and is updated daily on week days.
Initial download of the metrics may take a while.