Fig. 20
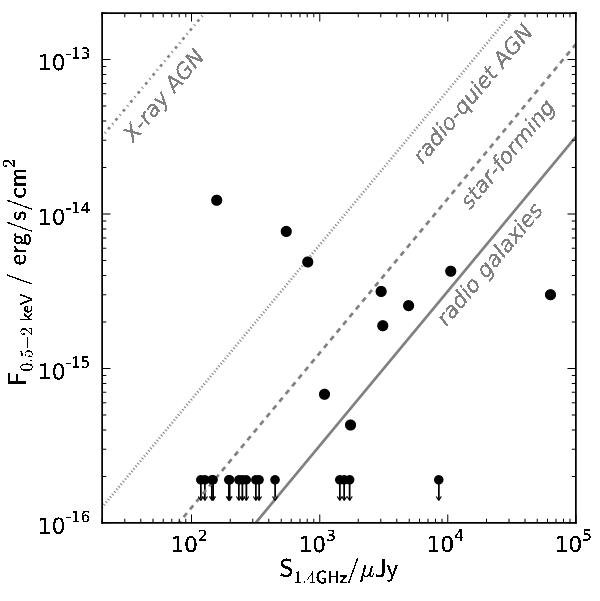
X-ray flux versus VLA flux density for the 26 sources inside the area covered by XMM-Newton. The lines denote the area occupied by X-ray AGN (dash-dotted line), radio-quiet AGN (dotted line), star-forming objects (dashed line) and radio galaxies (solid line), as presented in Padovani (2011). Upper limits are drawn for the 16 sources below the X-ray flux limit.
Current usage metrics show cumulative count of Article Views (full-text article views including HTML views, PDF and ePub downloads, according to the available data) and Abstracts Views on Vision4Press platform.
Data correspond to usage on the plateform after 2015. The current usage metrics is available 48-96 hours after online publication and is updated daily on week days.
Initial download of the metrics may take a while.