Fig. 16
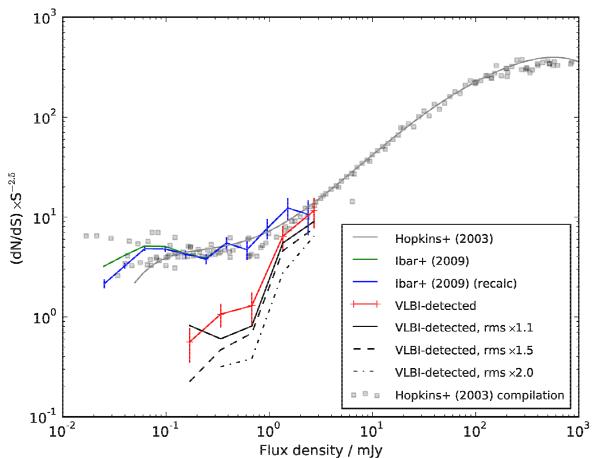
Source counts in the Lockman Hole/XMM field. Shown are the Euclidean-normalised source counts of the VLBA-detected sources, using their VLA flux densities (red line). Shown with black lines are source counts that would have been measured had the sensitivity of our observations been lower by factors of 1.1, 1.5, and 2.0. For comparison, we have plotted the source counts constructed from the Ibar et al. (2009) data using the same methods (blue line), the source counts as published by Ibar et al. (2009) (green line), and the data compilation from Hopkins et al. (2003) (light grey squares) along with their 6th order polynomial fit.
Current usage metrics show cumulative count of Article Views (full-text article views including HTML views, PDF and ePub downloads, according to the available data) and Abstracts Views on Vision4Press platform.
Data correspond to usage on the plateform after 2015. The current usage metrics is available 48-96 hours after online publication and is updated daily on week days.
Initial download of the metrics may take a while.