Fig. 13
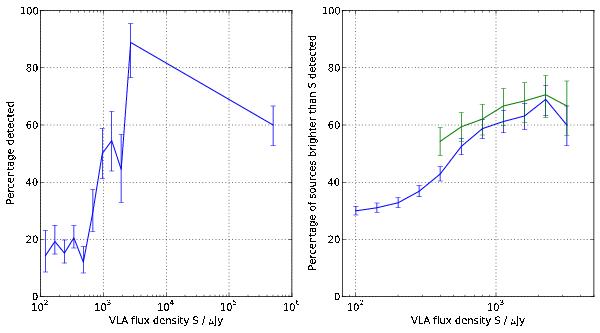
Fraction of VLBA-detected sources. Left panel: the fraction of
VLBA-detected sources as a function of flux density. Detectable sources have been
grouped into bins with limits
100 μJy ,
N = 0,1,2,...
Error bars denote the 68% confidence interval for a small-sample binomial
distribution, according to Clopper & Pearson
(1934). Whilst at the faintest flux density levels only around 15% have
been detected, this fraction rises sharply at a level of around 0.5 mJy, and
increases to more than 80% at the 2 mJy level. Right panel: using
the same bins as for the left panel, the fraction of detected sources brighter than
a bin limit has been calculated. Whilst of all sources brighter than
100 μJy 30% have been detected, the fraction reaches 60% when all
sources brighter than 1 mJy are considered. The green line indicates the data of the
CDFS from Middelberg et al. (2011a), which
had a maximum sensitivity of 55 μJy/beam,
compared to just under 20 μJy/beam in our
data. All curves are subject to small number statistics, which causes the Lockman
Hole data to drop at the bright end and the discrepancy between the CDFS and Lockman
Hole data.
,
N = 0,1,2,...
Error bars denote the 68% confidence interval for a small-sample binomial
distribution, according to Clopper & Pearson
(1934). Whilst at the faintest flux density levels only around 15% have
been detected, this fraction rises sharply at a level of around 0.5 mJy, and
increases to more than 80% at the 2 mJy level. Right panel: using
the same bins as for the left panel, the fraction of detected sources brighter than
a bin limit has been calculated. Whilst of all sources brighter than
100 μJy 30% have been detected, the fraction reaches 60% when all
sources brighter than 1 mJy are considered. The green line indicates the data of the
CDFS from Middelberg et al. (2011a), which
had a maximum sensitivity of 55 μJy/beam,
compared to just under 20 μJy/beam in our
data. All curves are subject to small number statistics, which causes the Lockman
Hole data to drop at the bright end and the discrepancy between the CDFS and Lockman
Hole data.
Current usage metrics show cumulative count of Article Views (full-text article views including HTML views, PDF and ePub downloads, according to the available data) and Abstracts Views on Vision4Press platform.
Data correspond to usage on the plateform after 2015. The current usage metrics is available 48-96 hours after online publication and is updated daily on week days.
Initial download of the metrics may take a while.