Fig. 12
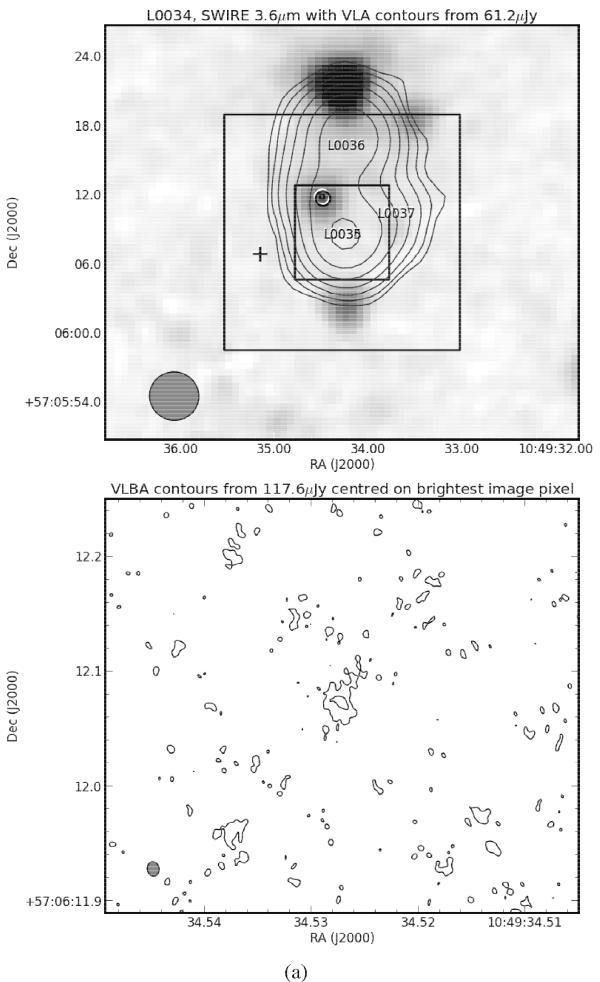
Example contour plots of the VLBA, VLA, and SWIRE data. The upper panel shows the logarithm of the SWIRE 3.6 μm emission as a pixel map, superimposed with contours of the VLA data of source L0034. Contours start at 2 times the local rms (as indicated in the plots) and increase by factors of 2. This object has four entries in the VLA catalogue: one, L0034, representing it as a source and three for its constituents, L0035, L0036, and L0037. Their locations are marked as labels in the image. Three black squares indicate (from large to small) (i) the regions imaged with the VLBA using a 10 Mλ taper; (ii) the region imaged using untapered data; and (iii) the region shown in the contour plot in the bottom panel. The maximum of the tapered VLBA data is marked with a cross, and the maximum of the untapered VLBA data is marked with an open circle. In this case, the maxima of the tapered and untapered VLBA images are not coincident, because the tapered image has reduced sensitivity. However, the maximum at full-resolution (6.2σ) coincides with a faint SWIRE source located between L0035 and L0036, indicating that this is the location of the AGN. Furthermore, the value of the tapered image exceeds 5σ at the location of the maximum of the untapered image, adding credibility to the detection. The bottom panel shows a contour map of a region 0.36 arcsec across, centred on the maximum of the untapered VLBA image. Contours start at 2 times the local rms (as indicated in the plots) and increase by factors of 2.
Current usage metrics show cumulative count of Article Views (full-text article views including HTML views, PDF and ePub downloads, according to the available data) and Abstracts Views on Vision4Press platform.
Data correspond to usage on the plateform after 2015. The current usage metrics is available 48-96 hours after online publication and is updated daily on week days.
Initial download of the metrics may take a while.