Fig. 1
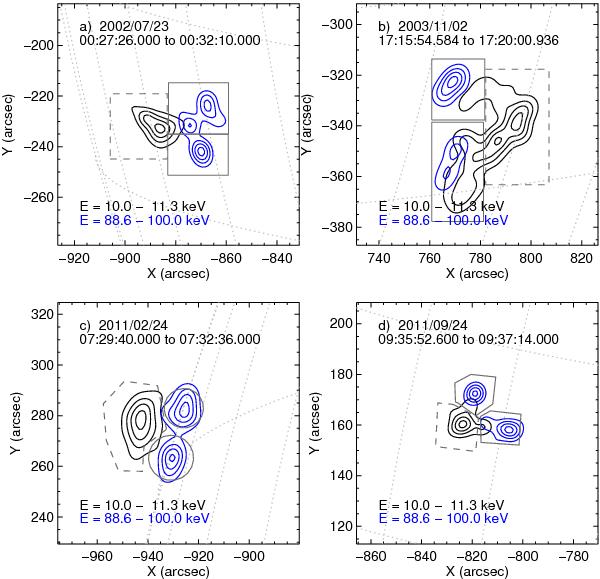
CLEAN maps for each flare: a) 2002 July 23; b) 2003 November 02; c) 2011 February 24; and d) 2011 September 24, showing the emission at 10−11.3 keV (black contours) and 88.6−100 keV (blue contours) at 30, 50, 70, 90% of maximum of each energy bin. The ROIs for the imaging spectroscopy are defined in gray lines: footpoints (continuous lines) and looptop (dashed lines). Integration times are shown in each frame and in Table 1. The CLEAN beam width factor used to construct each map according to the best agreement with visibility forward-fitting is also presented in Table 1. For each, a total of 19 maps were made with energy bins logarithmically spaced between 10 and 100 keV.
Current usage metrics show cumulative count of Article Views (full-text article views including HTML views, PDF and ePub downloads, according to the available data) and Abstracts Views on Vision4Press platform.
Data correspond to usage on the plateform after 2015. The current usage metrics is available 48-96 hours after online publication and is updated daily on week days.
Initial download of the metrics may take a while.