Free Access
Fig. 8
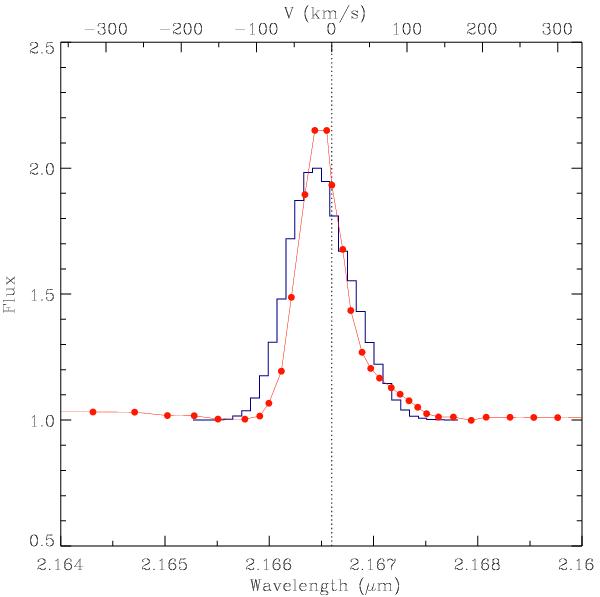
Observed AMBER HR flux profile is represented by the full line with small dots. The histogram shows the model spectrum which results from the geometric model with equal intensities for the Brγ emitting region.
Current usage metrics show cumulative count of Article Views (full-text article views including HTML views, PDF and ePub downloads, according to the available data) and Abstracts Views on Vision4Press platform.
Data correspond to usage on the plateform after 2015. The current usage metrics is available 48-96 hours after online publication and is updated daily on week days.
Initial download of the metrics may take a while.