Fig. 3
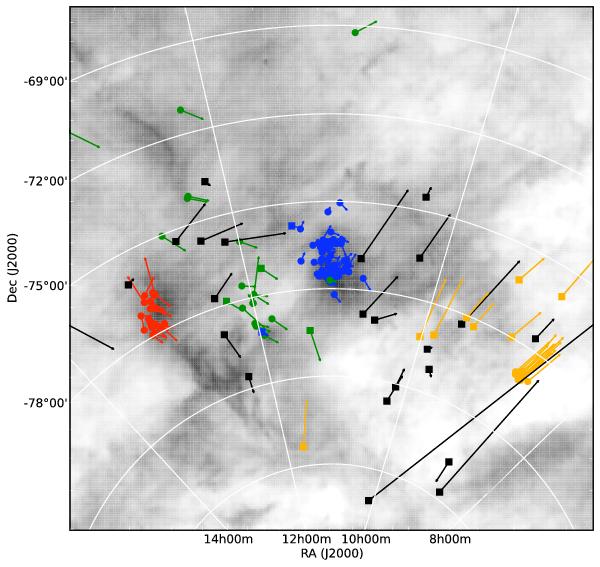
Current spatial location of the members of the Chamaeleon associations (circles) and of the ROSAT sources discussed in Sect. 4.1 (squares). Colours as in Fig. 1. Also shown are the expected displacement of these objects within 105 Myr. The background image is a dust map by Schlegel et al. (1998). Only objects with reliable proper motions are considered.
Current usage metrics show cumulative count of Article Views (full-text article views including HTML views, PDF and ePub downloads, according to the available data) and Abstracts Views on Vision4Press platform.
Data correspond to usage on the plateform after 2015. The current usage metrics is available 48-96 hours after online publication and is updated daily on week days.
Initial download of the metrics may take a while.