Fig. 9
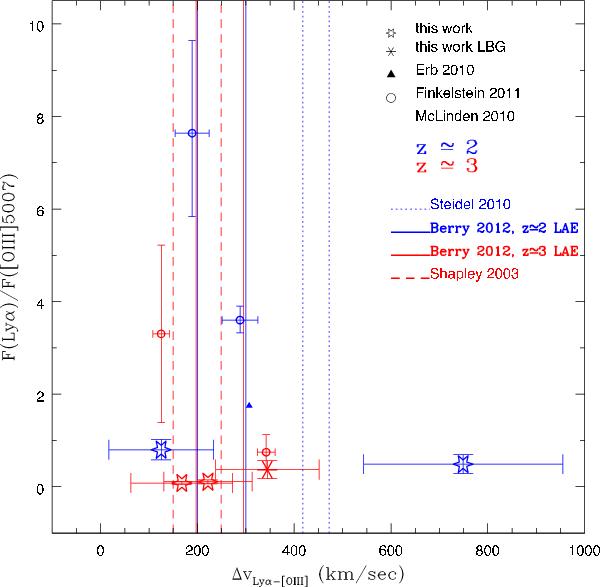
F(Lyα)/F([OIII]5007) ratio versus the velocity offset between the same emission line central wavelengths. We present LAEs at z ≃ 2 in blue and at z ≃ 3 in red. The red asterisk is for LBG11. Data from McLinden et al. (2011) and (Finkelstein et al. 2011, updated by Chonis et al. priv. comm.) are shown as circles, from Erb et al. (2010) as triangle. The vertical lines represent the ranges of ΔvLyα − LIS by Shapley et al. (2003) (dashed) at z ~ 3, Berry et al. (2012) (solid) at z ~ 2 and 3, roughly divided by 3 to be compared with ΔvLyα − [OIII] 5007 (see text), and Steidel et al. (2010) (dotted).
Current usage metrics show cumulative count of Article Views (full-text article views including HTML views, PDF and ePub downloads, according to the available data) and Abstracts Views on Vision4Press platform.
Data correspond to usage on the plateform after 2015. The current usage metrics is available 48-96 hours after online publication and is updated daily on week days.
Initial download of the metrics may take a while.