Fig. 6
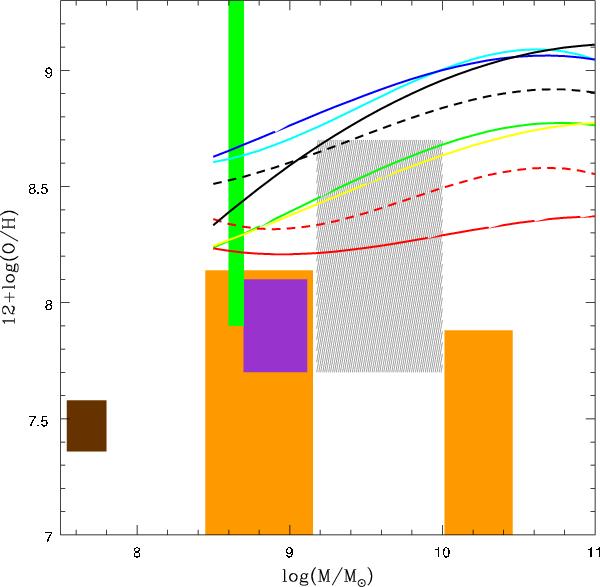
Mass-metallicty relations as presented in Kewley & Ellison (2008) for log (M/M⊙) > 8.5. The color-coding is the same as in their Fig. 2. The cyan curve is obtained from the R23 calibration, blue, dashed black, and dashed red from a combination of R23 and [OIII]/[OII], solid black from a combination of line ratios, such as [OII], Hβ, [OIII], Hα, [NII], [SII], solid green from O3N2, solid yellow from N2, and solid red from the measurement of the electron temperature, using [OIII]4363, 4990, 5007. Shaded regions indicate the mass-metallicity area occupied by literature results within the error bars. Also shown is the Atek et al. (2011) source in brown at the lowest mass range, Finkelstein et al. (2011) upper limits in orange, Nakajima et al. (2012b) lower limit in green, and the range of objects from Xia et al. (2012)z > 1 in grey. The sources in our survey are characterized by 9 < log (M/M⊙) < 10, where the N2 and O3N2 agree with all the other calibrations within 0.4 dex.
Current usage metrics show cumulative count of Article Views (full-text article views including HTML views, PDF and ePub downloads, according to the available data) and Abstracts Views on Vision4Press platform.
Data correspond to usage on the plateform after 2015. The current usage metrics is available 48-96 hours after online publication and is updated daily on week days.
Initial download of the metrics may take a while.