Fig. 5
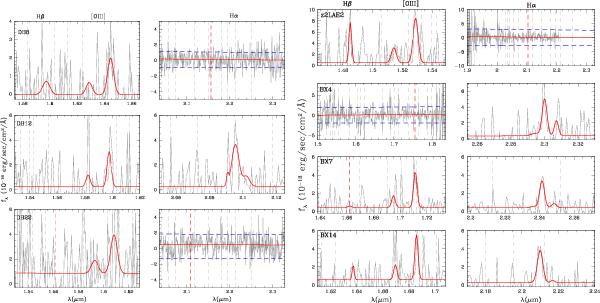
Observed 1D spectra (grey curves) of the SFGs detected in our survey, without spectroscopic rest-frame UV counterparts (DB8, DB12, DB22, z2LAE2, BX4, BX7, BX14). [OIII]doublet and Hα regions are shown. If only one of these is detected, red vertical dashed lines indicate the location of Hα ([OIII]5007) lines which would be implied by the detected-line redshift for DB8, DB22, z2LAE2 (BX4). Dashed grey vertical lines indicate the wavelength of sky emission lines, which could leave residuals in the science spectra. Horizontal dashed blue lines represent the continuum rms in the wavelength range where we did not see an expected emission line.
Current usage metrics show cumulative count of Article Views (full-text article views including HTML views, PDF and ePub downloads, according to the available data) and Abstracts Views on Vision4Press platform.
Data correspond to usage on the plateform after 2015. The current usage metrics is available 48-96 hours after online publication and is updated daily on week days.
Initial download of the metrics may take a while.