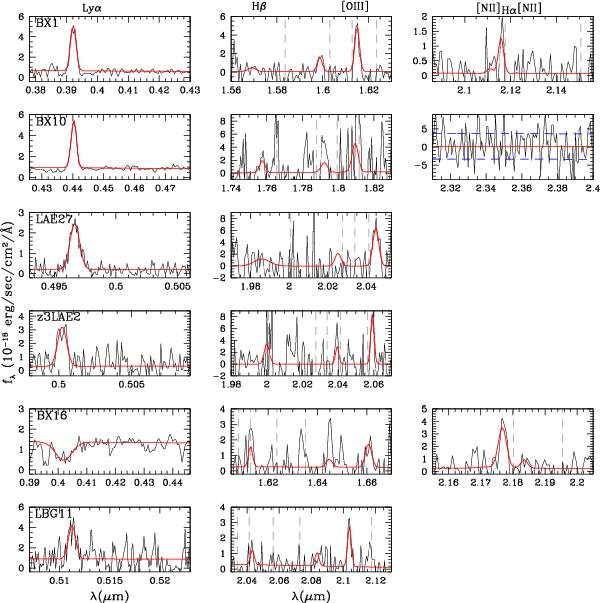
Fig. 4

Observed-frame 1D spectra (black curve) of the sources showing either Lyα in emission or in absorption in rest-frame UV spectra. In red we show the best fit model spectra. From the top BX1, BX10, LAE27, z3LAE2, BX16, LBG11. The first, second and third panel columns represent Lyα (from MUSYC and GOODS-VIMOS surveys), [OIII]doublet and Hα wavelength ranges respectively. Dashed vertical lines indicate the wavelength of sky emission lines, which could leave residuals in the science spectra. Horizontal dashed blue lines indicate the continuum rms in the wavelength range where we did not see an expected emission line. As LAE27, z3LAE2, and LBG11 are at z ~ 3, Hα line would fall outside the MMIRS coverage. The rest-frame optical emission lines are unresolved.
Current usage metrics show cumulative count of Article Views (full-text article views including HTML views, PDF and ePub downloads, according to the available data) and Abstracts Views on Vision4Press platform.
Data correspond to usage on the plateform after 2015. The current usage metrics is available 48-96 hours after online publication and is updated daily on week days.
Initial download of the metrics may take a while.


