Fig. 2
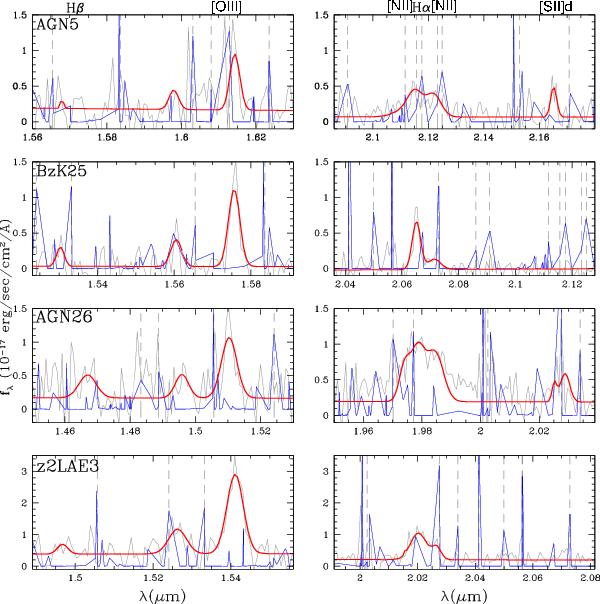
Observed 1D spectra of AGNs in grey and best fit in red. From the top AGN5, BzK25, AGN26, z2LAE3. Vertical dashed lines represent the wavelengths of sky line residuals. The blue curve is the sky spectrum by Rousselot et al. (2000), which indicates the relative intensity of the OH emission lines. It has been scaled according to the panel axis to be visible. [OIII] doublet (Hα) wavelength ranges are presented in the left (right) panels.
Current usage metrics show cumulative count of Article Views (full-text article views including HTML views, PDF and ePub downloads, according to the available data) and Abstracts Views on Vision4Press platform.
Data correspond to usage on the plateform after 2015. The current usage metrics is available 48-96 hours after online publication and is updated daily on week days.
Initial download of the metrics may take a while.