Fig. A.1
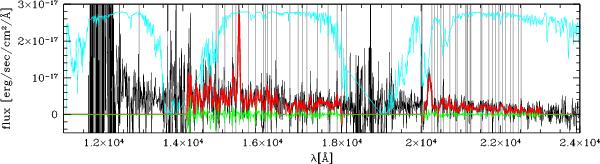
1D spectrum of z2LAE3 along the entire MMIRS coverage. The black (red) curve represents the raw (smoothed) spectrum. Grey vertical lines indicate the wavelength of the dominant sky emission lines. Cyan curve represents the atmospheric transmission at Las Campanas observatory. At λ ~ 14 000 and ~19 000 Å the transmission is very low. The green curve represents the background spectrum extracted far from the center of the slit where the source is positioned. Sky line residuals produce higher uncertainty. Telluric correction fixes the continuum shape but increases the uncertainty. Wavelength regions of high noise are not shown in the smoothed spectrum.
Current usage metrics show cumulative count of Article Views (full-text article views including HTML views, PDF and ePub downloads, according to the available data) and Abstracts Views on Vision4Press platform.
Data correspond to usage on the plateform after 2015. The current usage metrics is available 48-96 hours after online publication and is updated daily on week days.
Initial download of the metrics may take a while.