Fig. A.2
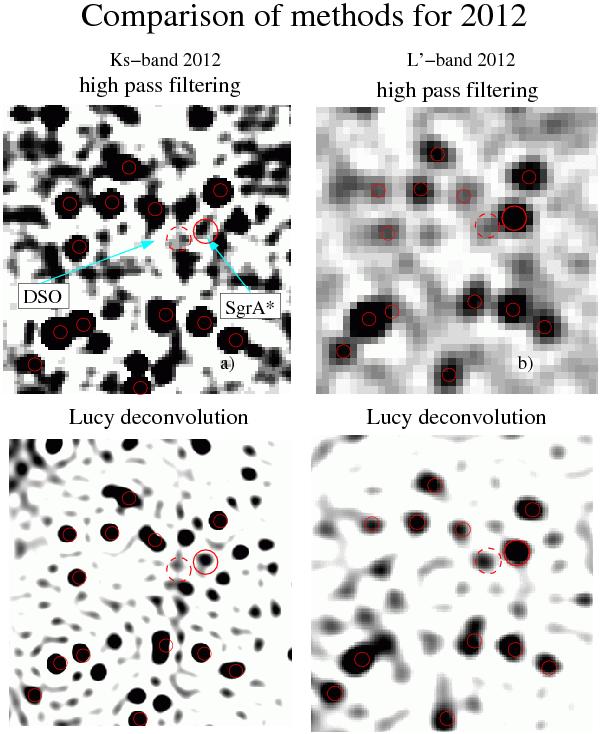
Retrieving the DSO in 2012 using different methods. Here we show a comparison of results from different data reduction methods and different Ks- and L′-band datasets for 2012. In both bands different methods result in a clear detection of a Ks- and L′-band counterpart of the DSO (see Ott et al. 1999, for a detailed comparison of deconvolution algorithms in the GC field). As the DSO is close to the confusion limit, the peak of the flux distribution within the diffraction limit results in small deviations in the apparent peak position.
Current usage metrics show cumulative count of Article Views (full-text article views including HTML views, PDF and ePub downloads, according to the available data) and Abstracts Views on Vision4Press platform.
Data correspond to usage on the plateform after 2015. The current usage metrics is available 48-96 hours after online publication and is updated daily on week days.
Initial download of the metrics may take a while.