Fig. 17
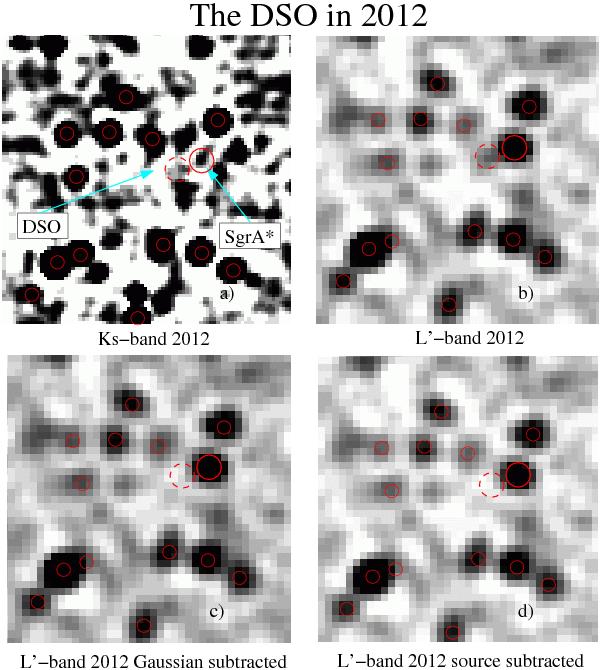
Comparison of DSO images in the a) Ks- (13.2 mas pixel scale) and b) L′-band (27 mas pixel scale). The image section size is 1′′ × 1′′. In c) and d) a Gaussian of 98 mas FWHM and a PSF from the image have been scaled to the DSO peak brightness and subtracted at its position. An astrometric grid of red circles marks some bright stars that can be used as positional references to compare the images at different wavelengths.
Current usage metrics show cumulative count of Article Views (full-text article views including HTML views, PDF and ePub downloads, according to the available data) and Abstracts Views on Vision4Press platform.
Data correspond to usage on the plateform after 2015. The current usage metrics is available 48-96 hours after online publication and is updated daily on week days.
Initial download of the metrics may take a while.