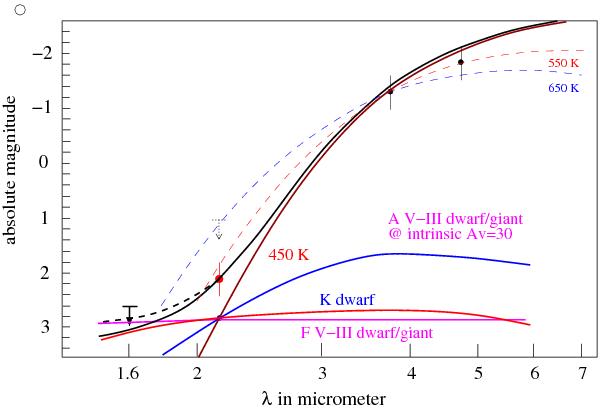
Fig. 15

Decomposition of the DSO spectrum including our Ks-band detection and H-band limit. Here we demonstrate that a mixture of dust and stellar contribution is possible. The points correspond to the L- and Ks-band magnitudes, and H-band upper limit from this work, and the M-band measurement and K-band upper limit of Gillessen et al. (2012a,b). Red and blue dashed curves also show their 550 K and 650 K warm dust fits. In solid blue, red, and magenta lines the emission from three different possible stellar types of the DSO core are plotted. Any of these stars embedded in 450 K dust (solid brown line) can produce the black line that fits all the NIR DSO photometric measurements.
Current usage metrics show cumulative count of Article Views (full-text article views including HTML views, PDF and ePub downloads, according to the available data) and Abstracts Views on Vision4Press platform.
Data correspond to usage on the plateform after 2015. The current usage metrics is available 48-96 hours after online publication and is updated daily on week days.
Initial download of the metrics may take a while.


