Fig. 11
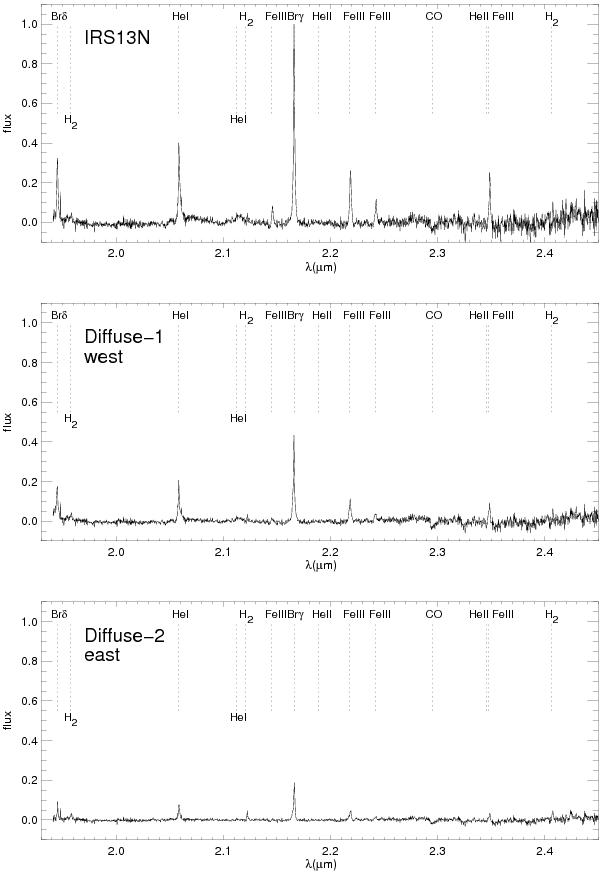
Integrated Ks-band spectrum of IRS13N (top panel), spectrum of the nearby region Diffuse-1 west of IRS13N (middle panel) and Diffuse-2 east of IRS13N (bottom). The three spectra were normalized to the peak value of the Brγ line in the IRS13N spectrum. The spectra are continuum subtracted.
Current usage metrics show cumulative count of Article Views (full-text article views including HTML views, PDF and ePub downloads, according to the available data) and Abstracts Views on Vision4Press platform.
Data correspond to usage on the plateform after 2015. The current usage metrics is available 48-96 hours after online publication and is updated daily on week days.
Initial download of the metrics may take a while.