Fig. 2
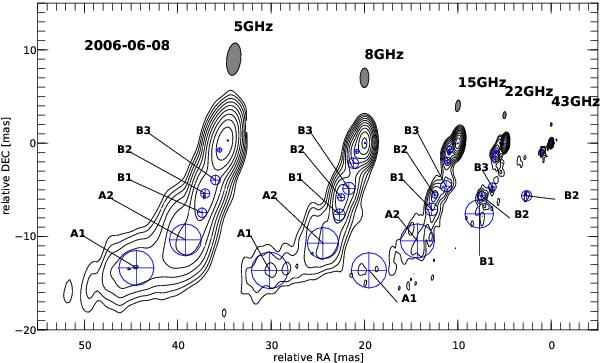
Uniform weighted VLBA CLEAN images with fitted circular Gaussian components at different frequencies for the 2006 July observation of CTA 102. The lowest contour is plotted at 10 × the off-source rms at 43 GHz and increases in steps of 2. The observing frequency and the restoring beam size are plotted above each map. For the labeling we used capital letters for the same physical region in the jet and the numbers increase with inverse distance from the core. For a more detailed picture of the core region see Fig. 3.
Current usage metrics show cumulative count of Article Views (full-text article views including HTML views, PDF and ePub downloads, according to the available data) and Abstracts Views on Vision4Press platform.
Data correspond to usage on the plateform after 2015. The current usage metrics is available 48-96 hours after online publication and is updated daily on week days.
Initial download of the metrics may take a while.