Fig. 17
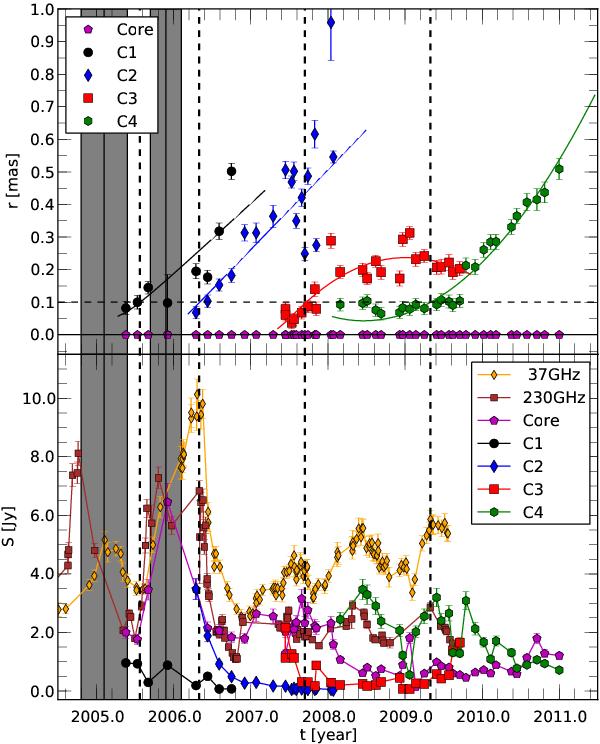
Evolution of the component separation from the core and the flux density for the innermost components of CTA 102. Top: separation from the core and fitted trajectories for C1, C2, C3, and C4. The gray shaded ares correspond to the ejection epochs for C1 and C2 and the dashed line to the crossing of a possible stationary feature at r ~ 0.1,mas away from the core (dashed horizontal line). Bottom: flux density evolution of the components including the core and single-dish flux density measurements at 37 GHz and 230 GHz. For details see text.
Current usage metrics show cumulative count of Article Views (full-text article views including HTML views, PDF and ePub downloads, according to the available data) and Abstracts Views on Vision4Press platform.
Data correspond to usage on the plateform after 2015. The current usage metrics is available 48-96 hours after online publication and is updated daily on week days.
Initial download of the metrics may take a while.