Fig. 12
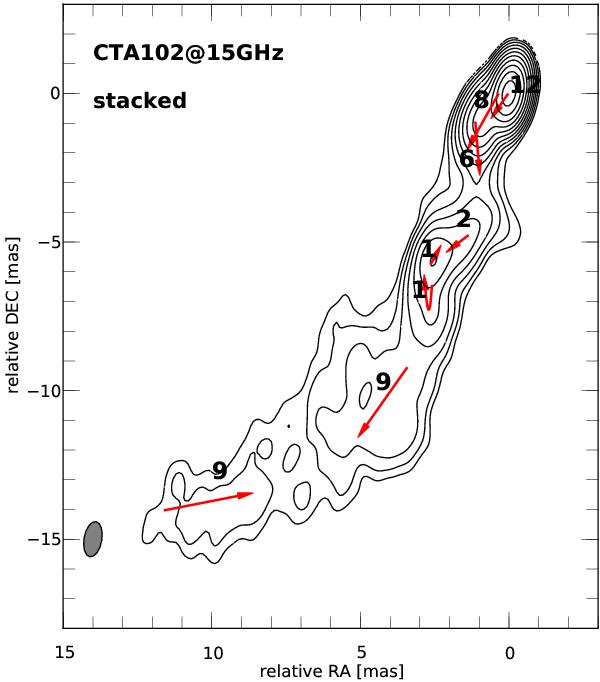
Vector motion map for CTA 102. The contour maps corresponds to the stacked 15 GHz observation of CTA 102, and the arrows indicate the trajectories of each cross-identified component. The lowest contour level is drawn at 5 × the average off-source rms (4 mJy) and the contours increase in steps of 2. The numbers above are the apparent speed of the component.
Current usage metrics show cumulative count of Article Views (full-text article views including HTML views, PDF and ePub downloads, according to the available data) and Abstracts Views on Vision4Press platform.
Data correspond to usage on the plateform after 2015. The current usage metrics is available 48-96 hours after online publication and is updated daily on week days.
Initial download of the metrics may take a while.