Free Access
Fig. 11
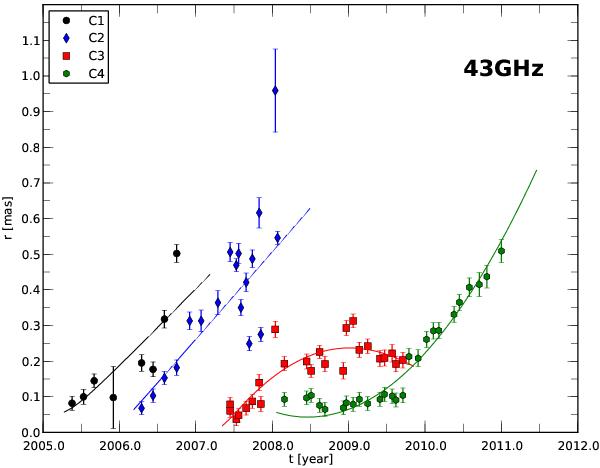
Temporal separation from the core for the components C1, C2, C3, and C4 at 43 GHz taken as the representative frequency for the evolution of the cross-identified components within this region. The solid lines correspond to a first-order polynomial fit to the x- and y-positions separately.
Current usage metrics show cumulative count of Article Views (full-text article views including HTML views, PDF and ePub downloads, according to the available data) and Abstracts Views on Vision4Press platform.
Data correspond to usage on the plateform after 2015. The current usage metrics is available 48-96 hours after online publication and is updated daily on week days.
Initial download of the metrics may take a while.