Free Access
Fig. 1
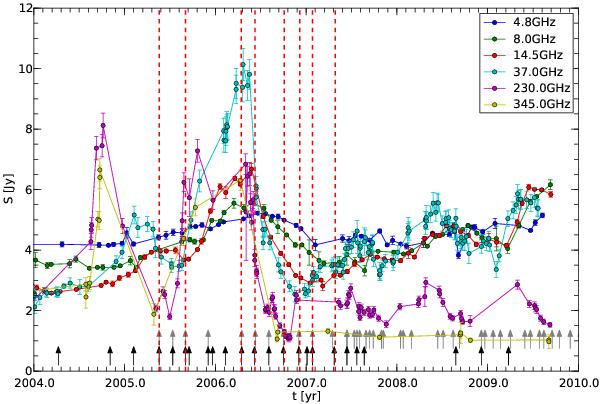
cm-mm single-dish light curves for CTA 102 covering the 2006 radio flare (see Paper I). The red dashed lines correspond to the epochs of multifrequency VLBI observations presented in this paper, the black arrows to the 15 GHz, and the gray arrows to the 43 GHz VLBA observations.
Current usage metrics show cumulative count of Article Views (full-text article views including HTML views, PDF and ePub downloads, according to the available data) and Abstracts Views on Vision4Press platform.
Data correspond to usage on the plateform after 2015. The current usage metrics is available 48-96 hours after online publication and is updated daily on week days.
Initial download of the metrics may take a while.