Free Access
Fig. 2
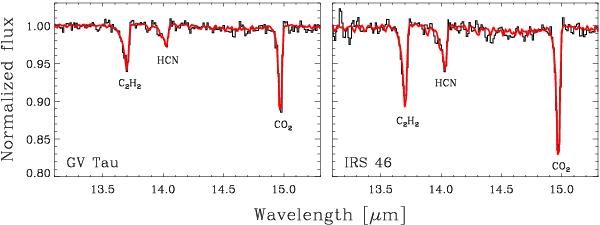
Continuum normalized spectra of GV Tau and IRS 46. Plotted in black are the observed spectra and overplotted in red the best-fit synthetic spectra to the absorption bands of C2H2ν5 = 1−0, HCN ν2 = 1−0 and CO2ν2 = 1−0. See Table 2 for best fit model parameters.
Current usage metrics show cumulative count of Article Views (full-text article views including HTML views, PDF and ePub downloads, according to the available data) and Abstracts Views on Vision4Press platform.
Data correspond to usage on the plateform after 2015. The current usage metrics is available 48-96 hours after online publication and is updated daily on week days.
Initial download of the metrics may take a while.