| Issue |
A&A
Volume 551, March 2013
|
|
|---|---|---|
| Article Number | A118 | |
| Number of page(s) | 24 | |
| Section | Interstellar and circumstellar matter | |
| DOI | https://doi.org/10.1051/0004-6361/201219908 | |
| Published online | 05 March 2013 | |
Online material
Appendix A: Discussion of specific disk models
In this section, we provide more details of the specific disk models to which our observational results are compared.
Appendix A.1: X-ray dominated region (XDR) surface layers
Najita et al. (2011) have analyzed the chemistry of the inner (0.25−20 AU) portions of protoplanetary disks exposed to X rays. The physical structure derives from the thermochemical model developed by Glassgold et al. (2009). The thermal structure is evaluated separately for dust and gas and the surface gas temperature significantly exceeds that of the dust in the upper layers. In their model, gas and dust temperatures are decoupled for column densities less than 1022 cm-2. If only the disk surface is considered (N < 3 × 1021 cm-2), gas temperatures of 300 K are reached out to radial distances of 4 AU.
The formation of hydrocarbons in this model is triggered by X-rays which produce He+ which liberates the C+ from CO and N from N2. Acetylene is subsequently produced by C and C+ insertion reactions with small hydrocarbon radicals (Fig. 8). Hence, the C2H2 abundance is sensitive to the X-ray ionization rate. Radicals such as OH are also sensitive to X-rays. At low temperature, OH results from the recombination of H3O+ produced by ion-molecule reactions and its abundance scales directly with the ionization rate. The formation rate of daughter species of OH such as NO, SO, SO2 and CO2 is similarly increased by X-ray ionization. However, if their destruction is also dominated by He+, their abundances are not sensitive to the X-ray ionization flux. This is the case for CO2, for example. Note that the models of Najita et al. (2011) do not include UV photodissociation and may thus underestimate the amount of OH that could be produced from H2O in the upper layers.
The transformation of N back to N2 is mediated by neutral reactions and is accompanied by significant column densities of warm nitrogen-bearing molecules such as HCN and NH3 in these models. Specifically, HCN is influenced by X-rays in its formation route both because it liberates N from N2 and then N reacts with OH to form NO, with NO subsequently reacting with C to form CN. HCN is then formed through reactions of CN with H2. Because of lack of photodissociation in the model, HCN is destroyed by He+ and hence destruction
is also sensitive to the X-ray. In the end, the HCN decreases slightly with X-ray luminosity in the models by Najita et al. (2011).
Appendix A.2: Photodissociation region (PDR) surface layers
Various recent models have analyzed the gas phase chemistry of hot inner regions of protoplanetary disks including UV radiation for the chemistry and heating of the gas (Agúndez et al. 2008; Woitke et al. 2009; Willacy & Woods 2009; Vasyunin et al. 2011; Walsh et al. 2012). The Agúndez et al. (2008) study is particularly instructive because they present models for just the photosphere of the disk, down to H2 column densities of 5 × 1021 cm-2 to which the UV penetrates. In their models, FUV photons and cosmic rays produce C, C+ and N. Atomic N is then channeled to HCN through a similar reaction routine as that described in Fig. 8. The C+ leads to a rich hydrocarbon radical chemistry. However, the formation of high abundances of C2H2 and CH4 requires the reaction of atomic C with H2 to proceed which has a very high activation barrier. This reaction only proceeds in very warm gas (T > 500 K) forming CH. This is reflected in the radial dependence of the C2H2 and CH4 columns, which reach values of ~1016 cm-2 out to radii of ~1 AU, but then drop by orders of magnitude in the colder gas. This rapid drop with disk radius is also seen in models by other authors. In contrast, the CO2 column increases with radius in the inner 1 AU since it favors somewhat colder gas.
Walsh et al. (2012) present a combined UV + X-ray model which shows that a correct treatment of the photodissociation is generally more important than including X-rays. For the important species considered here – C2H2, HCN, CO2, CH4 and NH3 – the column densities in the inner disk do not change measurably when X-rays are added to the UV model.
Appendix B: Auxilliary figures
This appendix presents simulations of the spectra of all molecules considered here at higher spectral resolving power of R = 3000 and R = 50 000, appropriate for future instruments. In addition, spectra at the Spitzer resolving power of R = 600 are included. All spectra are computed for Tex = 200, 500 and 1000 K, b = 5 km s-1 and a column density of 1 × 1016 cm-2.
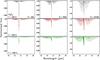 |
Fig. B.1
Synthetic spectrum of C2H2 at a column density of 1.0 × 1016 cm-2, excitation temperatures of 200 (top), 500 (middle) and 1000 K (bottom), and spectral resolving powers of 600 (left), 3000 (middle) and 50 000 (right). Note the different vertical scales for the different spectral resolving powers in this and subsequent figures. |
| Open with DEXTER | |
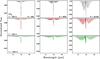 |
Fig. B.2
Synthetic spectrum of CO2 at a column density of 1.0 × 1016 cm-2, excitation temperatures of 200 (top), 500 (middle) and 1000 K (bottom), and spectral resolving powers of 600 (left), 3000 (middle) and 50 000 (right). |
| Open with DEXTER | |
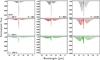 |
Fig. B.3
Synthetic spectrum of HCN at a column density of 1.0 × 1016 cm-2, excitation temperatures of 200 (top), 500 (middle) and 1000 K (bottom), and spectral resolving powers of 600 (left), 3000 (middle) and 50 000 (right). |
| Open with DEXTER | |
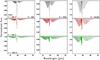 |
Fig. B.4
Synthetic spectrum of HNC at a column density of 1.0 × 1016 cm-2, excitation temperatures of 200 (top), 500 (middle) and 1000 K (bottom), and spectral resolving powers of 600 (left), 3000 (middle) and 50 000 (right). |
| Open with DEXTER | |
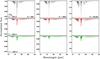 |
Fig. B.5
Synthetic spectrum of CH3 at a column density of 1.0 × 1016 cm-2, excitation temperatures of 200 (top), 500 (middle) and 1000 K (bottom), and spectral resolving powers of 600 (left), 3000 (middle) and 50 000 (right). |
| Open with DEXTER | |
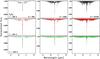 |
Fig. B.6
Synthetic spectrum of C2H4 at a column density of 1.0 × 1016 cm-2, excitation temperatures of 200 (top), 500 (middle) and 1000 K (bottom), and spectral resolving powers of 600 (left), 3000 (middle) and 50 000 (right). |
| Open with DEXTER | |
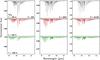 |
Fig. B.7
Synthetic spectrum of NH3 at a column density of 1.0 × 1016 cm-2, excitation temperatures of 200 (top), 500 (middle) and 1000 K (bottom), and spectral resolving powers of 600 (left), 3000 (middle) and 50 000 (right). |
| Open with DEXTER | |
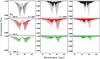 |
Fig. B.8
Synthetic spectrum of SO2 at a column density of 1.0 × 1016 cm-2, excitation temperatures of 200 (top), 500 (middle) and 1000 K (bottom), and spectral resolving powers of 600 (left), 3000 (middle) and 50 000 (right). |
| Open with DEXTER | |
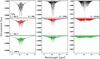 |
Fig. B.9
Synthetic spectrum of C2H6 at a column density of 1.0 × 1016 cm-2, excitation temperatures of 200 (top), 500 (middle) and 1000 K (bottom), and spectral resolving powers of 600 (left), 3000 (middle) and 50 000 (right). |
| Open with DEXTER | |
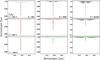 |
Fig. B.10
Synthetic spectrum of C4H2 at a column density of 1.0 × 1016 cm-2, excitation temperatures of 200 (top), 500 (middle) and 1000 K (bottom), and spectral resolving powers of 600 (left), 3000 (middle) and 50 000 (right). |
| Open with DEXTER | |
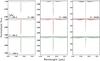 |
Fig. B.11
Synthetic spectrum of C6H6 at a column density of 1.0 × 1016 cm-2, excitation temperatures of 200 (top), 500 (middle) and 1000 K (bottom), and spectral resolving powers of 600 (left), 3000 (middle) and 50 000 (right). |
| Open with DEXTER | |
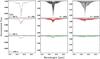 |
Fig. B.12
Synthetic spectrum of C3H4 at a column density of 1.0 × 1016 cm-2, excitation temperatures of 200 (top), 500 (middle) and 1000 K (bottom), and spectral resolving powers of 600 (left), 3000 (middle) and 50 000 (right). |
| Open with DEXTER | |
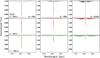 |
Fig. B.13
Synthetic spectrum of HC3N at a column density of 1.0 × 1016 cm-2, excitation temperatures of 200 (top), 500 (middle) and 1000 K (bottom), and spectral resolving powers of 600 (left), 3000 (middle) and 50 000 (right). |
| Open with DEXTER | |
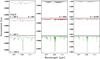 |
Fig. B.14
Synthetic spectrum of CH3CN at a column density of 1.0 × 1016 cm-2, excitation temperatures of 200 (top), 500 (middle) and 1000 K (bottom), and spectral resolving powers of 600 (left), 3000 (middle) and 50 000 (right). |
| Open with DEXTER | |
© ESO, 2013
Current usage metrics show cumulative count of Article Views (full-text article views including HTML views, PDF and ePub downloads, according to the available data) and Abstracts Views on Vision4Press platform.
Data correspond to usage on the plateform after 2015. The current usage metrics is available 48-96 hours after online publication and is updated daily on week days.
Initial download of the metrics may take a while.