Fig. 1
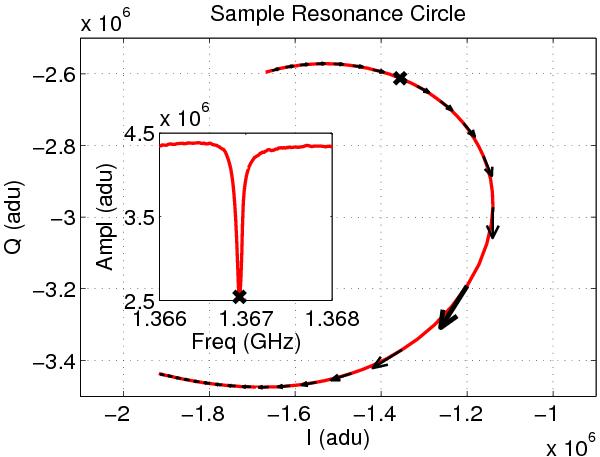
Typical KID resonance circle in raw A/D units at the input of the FPGA. The line (red
online) represents the (I, Q) data of the frequency
sweep around the resonance, and the arrows are the
 ,
,
 measured for a 2 kHz modulation of the LO. The largest arrow corresponds to the
frequency where the amplitude of the ,
vector is the largest: this is the frequency used to read out the detector.
measured for a 2 kHz modulation of the LO. The largest arrow corresponds to the
frequency where the amplitude of the ,
vector is the largest: this is the frequency used to read out the detector.
Current usage metrics show cumulative count of Article Views (full-text article views including HTML views, PDF and ePub downloads, according to the available data) and Abstracts Views on Vision4Press platform.
Data correspond to usage on the plateform after 2015. The current usage metrics is available 48-96 hours after online publication and is updated daily on week days.
Initial download of the metrics may take a while.