Fig. 3
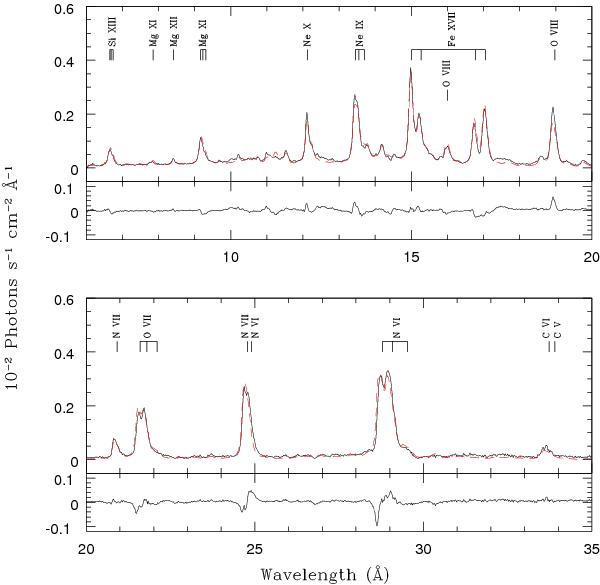
Our best-fit model (model1 of Table 3, in dashed red line) of the observed RGS spectrum of ζ Pup (represented as a solid black line). The most prominent emission lines are labelled. We note that there are many more weaker lines that contribute to the spectrum and are included in our model. The residuals (in the sense observation minus model) are shown in the panels below the spectrum.
Current usage metrics show cumulative count of Article Views (full-text article views including HTML views, PDF and ePub downloads, according to the available data) and Abstracts Views on Vision4Press platform.
Data correspond to usage on the plateform after 2015. The current usage metrics is available 48-96 hours after online publication and is updated daily on week days.
Initial download of the metrics may take a while.