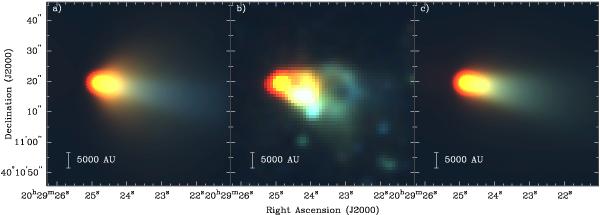
Fig. 2

a) Model three-colour J, H and Ks band image for the envelope with disk model (RGB: K, H, and J bands respectively). b) Observed 2MASS three-colour image of AFGL 2591. c) Model J, H, and Ks band image for the envelope without disk model. The model images have been normalised to the total integrated fluxes given in Table 3, in order that the morphology of the emission can be easily compared. Stretch: red: Ks band, 130−300 MJy sr-1; green: H band, 95−150 MJy sr-1, blue: J band, 30−60 MJy sr-1.
Current usage metrics show cumulative count of Article Views (full-text article views including HTML views, PDF and ePub downloads, according to the available data) and Abstracts Views on Vision4Press platform.
Data correspond to usage on the plateform after 2015. The current usage metrics is available 48-96 hours after online publication and is updated daily on week days.
Initial download of the metrics may take a while.


