| Issue |
A&A
Volume 551, March 2013
|
|
|---|---|---|
| Article Number | A43 | |
| Number of page(s) | 23 | |
| Section | Interstellar and circumstellar matter | |
| DOI | https://doi.org/10.1051/0004-6361/201219657 | |
| Published online | 18 February 2013 | |
Online material
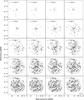 |
Fig. 11
13CO channel map at 0.3 km s-1 resolution between –12.0 and –5.7 km s-1. The rms in the map is σ = 0.1 Jy beam-1. The map peak flux is 1.3 Jy beam-1. Contours are at –3, 3, 5, 10, 15 × σ. The synthesised beam is shown in the bottom left-hand corner (4.4′′ × 3.7′′, PA 96°). A scale size of 0.5 pc is represented by a bar in the bottom right-hand panel. The cross shows the position of the central source of AFGL 2591 from the Gemini near-IR J band image. The rest velocity of the cloud is –5.7 km s-1. |
| Open with DEXTER | |
 |
Fig. 12
13CO channel map at 0.3 km s-1 resolution between –5.7 and 0.6 km s-1. The rms in the map is σ = 0.1 Jy beam-1. The map peak flux is 1.3 Jy beam-1. Contours are at –3, 3, 5, 10, 15 × σ. The synthesised beam is shown in the bottom left-hand corner (4.4′′ × 3.7′′, PA 96°). A scale size of 0.5 pc is represented by a bar in the bottom right-hand panel. The cross shows the position of the central source of AFGL 2591 from the Gemini near-IR J band image. The rest velocity of the cloud is –5.7 km s-1. |
| Open with DEXTER | |
© ESO, 2013
Current usage metrics show cumulative count of Article Views (full-text article views including HTML views, PDF and ePub downloads, according to the available data) and Abstracts Views on Vision4Press platform.
Data correspond to usage on the plateform after 2015. The current usage metrics is available 48-96 hours after online publication and is updated daily on week days.
Initial download of the metrics may take a while.