Fig. 7
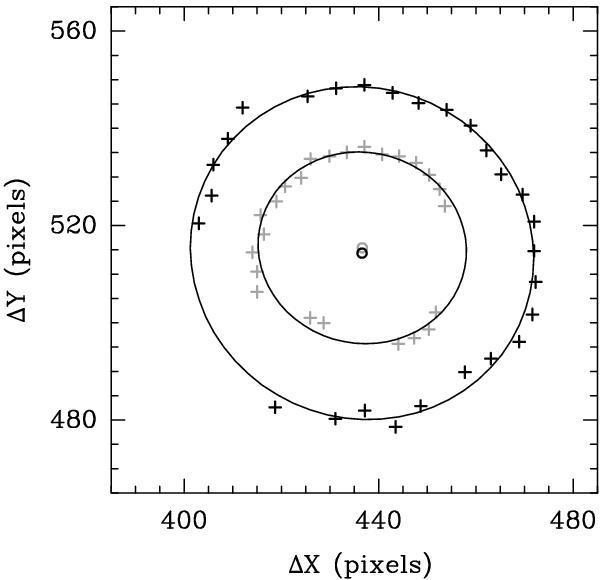
Contour fitting for IRAS 17319−6234. The inner (gray) and outer (black) crosses sample the envelope at 10° intervals in azimuth and at 20% and 40% of the peak intensity, respectively. Gaps in the data correspond to masked regions of the image. The curves show the fitted ellipses; the small inner circles show the fitted centers.
Current usage metrics show cumulative count of Article Views (full-text article views including HTML views, PDF and ePub downloads, according to the available data) and Abstracts Views on Vision4Press platform.
Data correspond to usage on the plateform after 2015. The current usage metrics is available 48-96 hours after online publication and is updated daily on week days.
Initial download of the metrics may take a while.