Fig. 12
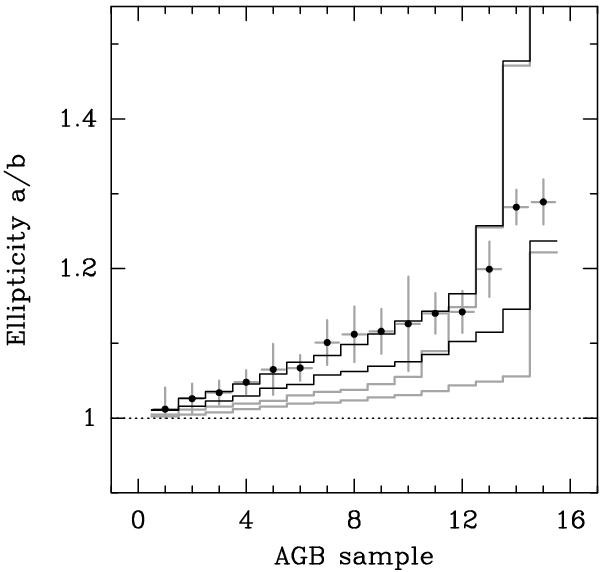
Comparison of the observed ellipticities of the AGB sample with calculated distribution functions. The points are the observations, and the vertical error bars denote the 1-σ uncertainties. The upper and lower gray histograms are population synthesis predictions including the measurement errors for case 1 (g(q0) = 1) and case 2 ( ), respectively. The upper and lower black histograms are population synthesis predictions including a residual ellipticity for case 1 and case 2, respectively. See text for details.
Current usage metrics show cumulative count of Article Views (full-text article views including HTML views, PDF and ePub downloads, according to the available data) and Abstracts Views on Vision4Press platform.
Data correspond to usage on the plateform after 2015. The current usage metrics is available 48-96 hours after online publication and is updated daily on week days.
Initial download of the metrics may take a while.