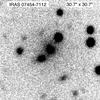
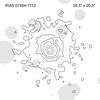
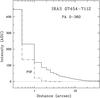
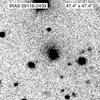
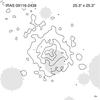
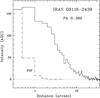
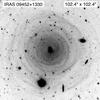
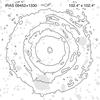
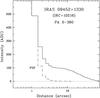
Fig. 1
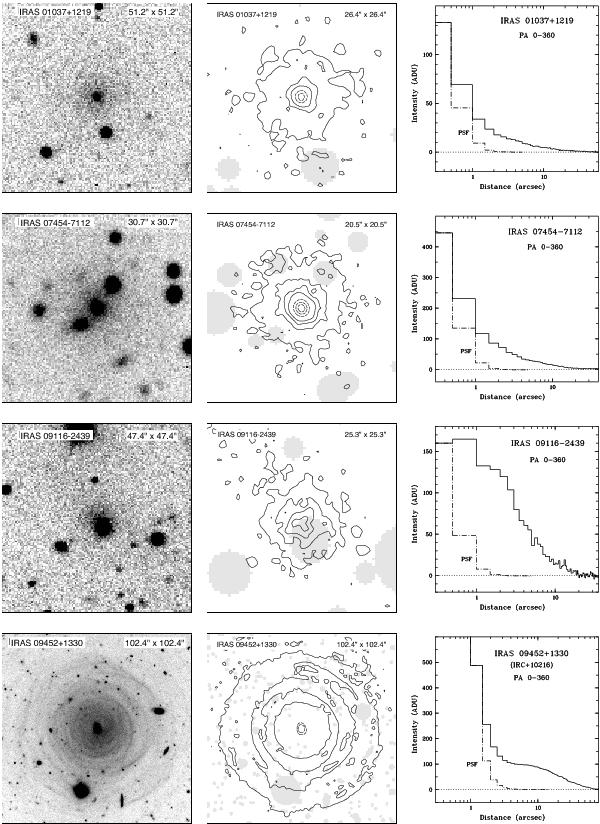
Images and radial profiles of the AGB envelopes. Each row shows from left to right: the image in grayscale; a close-up contour map of the envelope, with field stars removed and their cores masked; and the radial profile of the envelope with the PSF. The field size is indicated in the images. The filters and contours, specified by the lowest contour (and contour interval) in units of the peak surface brightness of the envelope, are as follows (from top to bottom): IRAS 01037+1219, V-band, contours 0.33 (0.43); IRAS 07454−7112, B-band, contours 0.31 (0.23); IRAS 09116−2439, B-band, contours 0.28 (0.26); IRAS 09452+1330, V-band, contours 0.32 (0.16). The images are square, with north to the top and east to the left.
Current usage metrics show cumulative count of Article Views (full-text article views including HTML views, PDF and ePub downloads, according to the available data) and Abstracts Views on Vision4Press platform.
Data correspond to usage on the plateform after 2015. The current usage metrics is available 48-96 hours after online publication and is updated daily on week days.
Initial download of the metrics may take a while.