Fig. 3
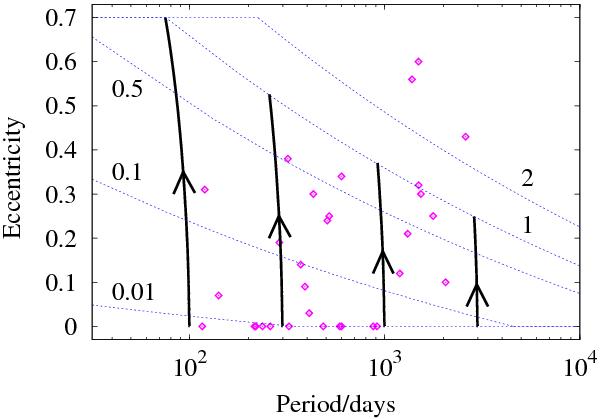
Evolutionary tracks during the post-AGB phase (black lines) in the e − log P plane including the interaction with a circumbinary disc as described by Eqs. (7) and (9) (see also Fig. 1) with the adopted circumbinary-disc properties of Table 1. The ⋄ symbols are observed post-AGB systems. The blue dashed lines show the final eccentricity corresponding to eccentricity-pumping as given by Eq. (9), modulated by the labelled values (1 corresponds to the adopted parameters). The timescale needed to pump the eccentricity can be estimated from Eq. (12).
Current usage metrics show cumulative count of Article Views (full-text article views including HTML views, PDF and ePub downloads, according to the available data) and Abstracts Views on Vision4Press platform.
Data correspond to usage on the plateform after 2015. The current usage metrics is available 48-96 hours after online publication and is updated daily on week days.
Initial download of the metrics may take a while.