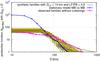
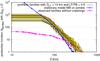
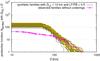
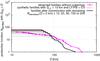
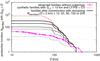
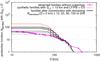
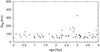
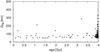
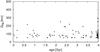
Fig. 5
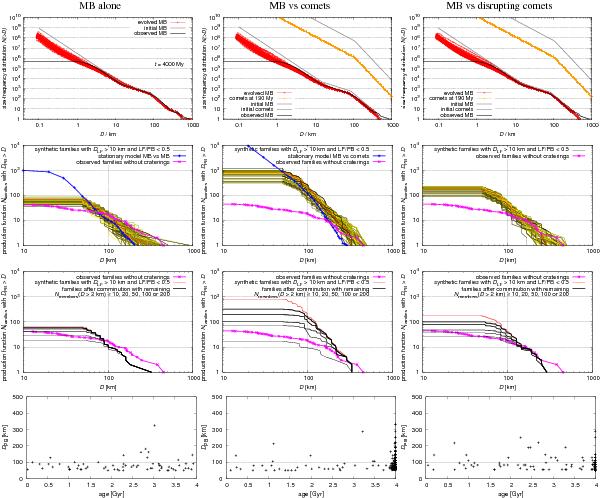
Results of three different collisional models: main belt alone which is discussed in Sect. 3 (left column), main belt and comets from Sect. 4 (middle column), main belt and disrupting comets from Sect. 7 (right column). 1st row: the initial and evolved SFDs of the main belt populations for 100 Boulder simulations; 2nd row: the resulting family production functions (in order to distinguish 100 lines we plot them using different colours ranging from black to yellow) and their comparison to the observations; 3rd row: the production function affected by comminution for a selected simulation; and 4th row: the distribution of synthetic families with DPB ≥ 50 km in the (age, DPB) plot for a selected simulation, without comminution. The positions of synthetic families in the 4th-row figures may differ significantly for a different Boulder simulation due to stochasticity and low-number statistics. Moreover, in the middle and right columns, many families were created during the LHB, so there are many overlapping crosses close to 4 Gyr.
Current usage metrics show cumulative count of Article Views (full-text article views including HTML views, PDF and ePub downloads, according to the available data) and Abstracts Views on Vision4Press platform.
Data correspond to usage on the plateform after 2015. The current usage metrics is available 48-96 hours after online publication and is updated daily on week days.
Initial download of the metrics may take a while.