Fig. 2
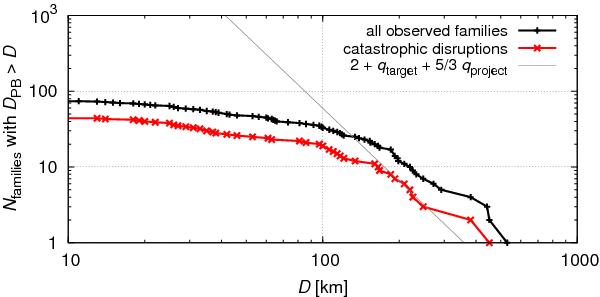
A production function (i.e. the cumulative number N(>D) of families with parent-body size DPB larger than D) for all observed families (black) and families corresponding to catastrophic disruptions (red), i.e. with largest remnant/parent body mass ratio lower than 0.5. We also plot a theoretical slope according to Eq. (1), assuming qtarget = −3.2 and qproject = −1.2, which correspond to the slopes of the main belt population in the range D = 100–200 km and D = 15–60 km, respectively.
Current usage metrics show cumulative count of Article Views (full-text article views including HTML views, PDF and ePub downloads, according to the available data) and Abstracts Views on Vision4Press platform.
Data correspond to usage on the plateform after 2015. The current usage metrics is available 48-96 hours after online publication and is updated daily on week days.
Initial download of the metrics may take a while.