Fig. 15
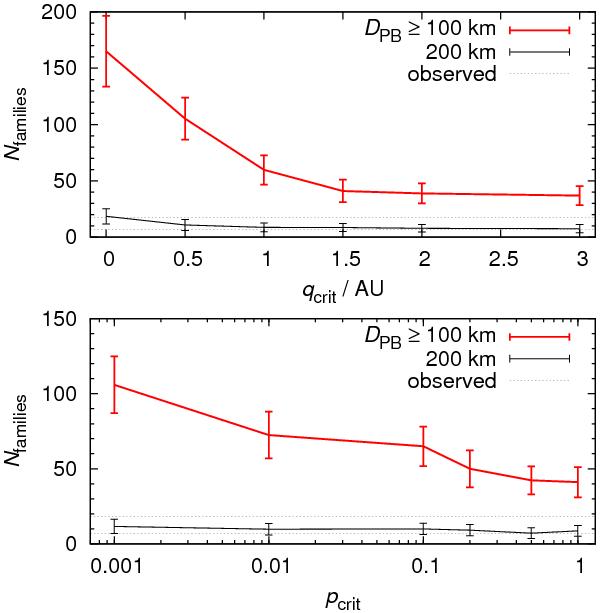
Numbers of collisional families for different critical perihelion distances qcrit at which comets break up and disruption probabilities pcrit during one time step (Δt = 500 yr). In the top panel, we vary qcrit while keeping pcrit = 1 constant. In the bottom panel, qcrit = 1.5 AU is constant and we vary pcrit. We always show the number of catastrophic disruptions with parent-body sizes DPB ≥ 100 km (red line) and 200 km (black line). The error bars indicate typical (1-σ) spreads of Boulder simulations with different random seeds. The observed numbers of corresponding families are indicated by thin dotted lines.
Current usage metrics show cumulative count of Article Views (full-text article views including HTML views, PDF and ePub downloads, according to the available data) and Abstracts Views on Vision4Press platform.
Data correspond to usage on the plateform after 2015. The current usage metrics is available 48-96 hours after online publication and is updated daily on week days.
Initial download of the metrics may take a while.