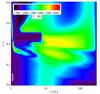
Fig. 17
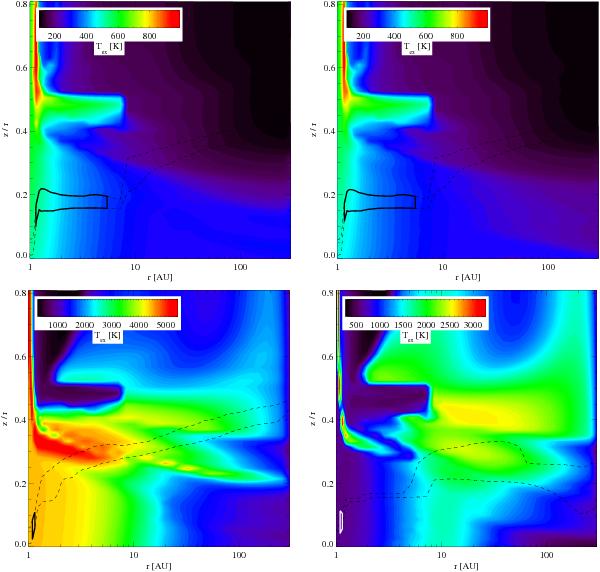
Excitation temperatures Tex between the upper and lower level of the CO v = 1−0 P(19) transition at 4.844 μm v = 1,J = 19 (upper two panels) and that of the CO v = 4−3 P(20) transition at 4.692 μm v = 4,J = 20 (lower two panels) transitions for the Mdisc = 10-2M⊙, Rin = 1 AU disc models with (left panels, model 1a) and without (right panels, model 1b) UV pumping. The solid contours (in white or black) in the CO density panels encompass the regions that emit 49% of the fluxes. The black dashed-line contours contain 70% of the fluxes in the vertical direction. The white contours are at gas temperatures of 500 and 1000 K.
Current usage metrics show cumulative count of Article Views (full-text article views including HTML views, PDF and ePub downloads, according to the available data) and Abstracts Views on Vision4Press platform.
Data correspond to usage on the plateform after 2015. The current usage metrics is available 48-96 hours after online publication and is updated daily on week days.
Initial download of the metrics may take a while.